
Urban infrastructure is an essential component that supports the functioning of modern cities and the lives of their inhabitants, and its quality and efficiency are directly related to the sustainability of urban development. With the acceleration of urbanization and population growth, there is an urgent need for more efficient and sustainable solutions for urban infrastructure construction.
Innovative new materials and processes have become the key to improving the quality and efficiency of urban infrastructure construction. New materials not only have higher strength and durability, providing more reliable support for infrastructure, but their application significantly improves construction speed and efficiency [1-3]. As the high-speed period of large-scale rigid demand for infrastructure construction in China has passed, some of the high speeds of infrastructure and real estate development are no longer available. Therefore, the economic construction of building materials products to reduce the growth in demand, is bound to reduce the building materials industry investment in fixed assets, relying on the power of investment is no longer the building materials industry is looking forward to [4-6]. Building materials traditional growth model and the single pursuit of quantitative growth development approach is no longer suitable for the new development needs, the contradiction between supply and demand to bring most of the industry and most of the economic benefits of the enterprise is not stable [7,8]. The innovation of engineering materials in the construction industry, promote China’s manufacturing and China’s creation at the same time opened up a new economic growth point, the industry shows a new look [9-11]. Science and technology is the first productive force, science and technology innovation in the building materials industry so that a large number of high-end technology to leap into the world’s leading, and promote the building materials industry into a new era of China’s manufacturing and China’s creation and enter a new cross-border development period [12-15]. Due to the enhancement of scientific and technological innovation, the development of new economic growth points of the dual role, so that in the serious overcapacity, business and efficiency decline in the building materials industry has ushered in its own spring, a number of industries, a large number of enterprises on the track of high-quality development [16-19].
The innovation of the study is to investigate the impact of engineering materials innovation on regional economic growth from multiple perspectives, and to clarify the role of engineering materials industry factors and policy factors in the above relationship. The research design utilizes the theories of economic growth, industrial upgrading, technological innovation and sustainable development, and combines the relevant knowledge of econometrics. A threshold regression model is established with the regional economic growth index (GDP) as the explanatory variable, and engineering materials innovation (INN), policy subsidies (GOV), physical capital (PC), and industrial clustering (HTIC) as the explanatory variables, with the aim of revealing the role of engineering materials innovation in promoting economic growth, and making reasonable suggestions for the formulation of related policies.
New construction materials are materials with entirely new physical, chemical or material properties that meet specific needs in various fields. The innovation and application of new materials in the construction of urban infrastructure is essential to improve the efficiency, quality and sustainability of infrastructure development. Depending on the nature and scope of application, new materials for municipal construction can be categorized as follows:
High-performance concrete: A common new material is high-performance concrete, which has excellent strength, durability and crack resistance properties and is widely used in urban infrastructure projects such as bridges, tunnels and underground structures. High-performance concrete is prepared through precise control of material composition and proportioning, and special processing techniques. It is capable of withstanding greater loads and deformations, extending the service life of infrastructure and reducing repair and maintenance costs.
Recycled Building Materials: Recycled building materials, is the use of waste or recycled materials manufactured. Recycled building materials not only reduce the consumption of resources, but also reduce environmental pollution, and are suitable for the walls, floors and roofs of buildings. Common recycled building materials include recycled concrete, recycled glass and recycled metals. These materials realize the effective use of resources and the development of a circular economy by recycling and reusing waste. In addition, new materials such as waterproof materials, energy-saving materials and composite materials are also widely used in municipal construction.
Waterproof materials: Used to protect buildings and infrastructure from water erosion and infiltration.
Energy-saving materials: Used to improve the energy efficiency of buildings and reduce energy consumption.
Composite Materials: Combined with materials of different properties, they have high strength, light weight, corrosion resistance and good anti-seismic properties, and are often used in the fields of bridges, pipelines and underground structures.
In urban infrastructure construction, the main bodies involved in technological innovation of engineering materials in the construction industry include the government, consumers, and construction industry enterprises.
Government: The government is the driving body of engineering material innovation in urban infrastructure construction. In order to realize the environmental and economic benefits, the government will promote the innovation and development of engineering materials technology in the construction industry through environmental regulation, so as to further realize the win-win situation of industrial economic growth and environmental protection. Therefore, this paper defines the government as the driving body of technological innovation.
Consumption: Consumers, i.e. the feedback subject of engineering material innovation. Consumer feedback on engineering material innovation is reflected in the process of consumer choice of construction products produced by technological innovation in the construction industry, and the degree of acceptance and diffusion of construction products produced by consumers of new technologies will directly affect the direction of the development of technological innovation and the direction of market promotion. Therefore, this paper defines the consumer, as the feedback subject of engineering materials innovation in the construction industry.
Construction Industry Enterprises: Construction industry enterprises are the implementation of engineering materials innovation, but also the dominant player in technological innovation, construction industry enterprises through the adoption of innovative ideas, research and development activities, so as to produce or accept new technologies, the formation of new production methods, and then produce new construction products, to open up new markets. Therefore, this paper regards construction enterprises as the implementation body of engineering material innovation in the construction industry, and at the same time, based on the definition standard of construction enterprises in the Statistical Yearbook of China’s Construction Industry, defines construction enterprises as all construction enterprises with qualification levels of general contracting and specialized contracting.
The modular reconstruction of the value chain of China’s building materials industry is shown in Figure 1. In this modular reconfiguration of the industrial value chain, enterprises can choose business combinations according to their own resource conditions, break through the limitations of departmental and geographical divisions, and seek the optimal allocation of resources. The modular organization formed can be divided into two categories: One is the module integration enterprise, which refers to the general contracting enterprise in the construction industry. The second is the module production enterprise, the construction industry refers to subcontracting enterprises and various types of specialized enterprises.
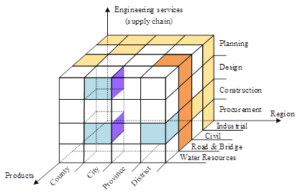
Each link in the value chain gathers a number of firms, and an upstream module integration (general contracting) firm can face a number of downstream module manufacturing (subcontracting or specialization) firms at the same time. A downstream module manufacturing enterprise (subcontracting or specialization) can also face several upstream module integration (general contracting) enterprises at the same time. This makes the unidirectional contractual relationship in the original value chain broken, and a net-like contractual relationship is formed between enterprises, and the industrial value chain has also completed the evolution from a single vertical chain structure to a three-dimensional value structure.
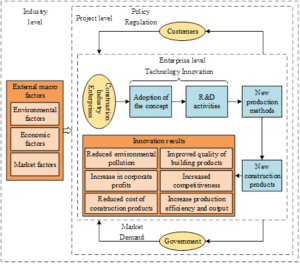
The engineering material innovation model of the construction industry proposed in this paper is established based on the definition of the innovation subject and the reconstruction of the value chain, as shown in Figure 2. The construction industry engineering materials innovation is guided by the innovation goal and strategy at the enterprise level, which is the starting point of the enterprise’s own innovation behavior, and actually occurs at the project level in the interaction process with the government and consumers. Eventually, through the diffusion of new technologies in the construction industry enterprises to realize the impact on the industry level, and the construction industry in the macro-external environment, in turn, affecting the goals and strategies of the construction industry enterprises, and thus the cycle repeats itself, realizing the construction industry’s engineering materials innovation.
Economic theory states that the process of sustained economic development is the process of constantly breaking through the primary factor constraints at a given stage of economic development. It is assumed that at a given point in time \(\Delta t\), total output \(Y\) and total input \(I\) in the economic system are divided into corresponding shares according to the type of input factor: \[\label{GrindEQ__1_} Y=Y_{L} +Y_{K} +Y_{T} +Y_{R} +Y_{S} , \tag{1}\] \[\label{GrindEQ__2_} I=I_{L} +I_{K} +I_{T} +I_{R} +I_{S} , \tag{2}\] where \(Y\) and \(I\) are total output and total inputs expressed in monetary terms during the \(\Delta t\) time period, respectively (or \(Y\) numerically equal to the GDP of a given year if \(\Delta t\) it is that year). \(L,K,T,R,S\) then denote labor, capital, technological inputs, natural factors and social factors, respectively.
The total economic efficiency \(\theta\) of the economic system at this point in time can then be defined as: \[\label{GrindEQ__3_} \theta =\frac{Y}{I\cdot \Delta t} . \tag{3}\]
Accordingly, the efficiency of the use of various factors of production is: \[\label{GrindEQ__4_} \theta _{i} =\frac{Y_{i} }{I_{i} \cdot \Delta t} , \tag{4}\] where \(i\) is \(L,K,T,R,S\) respectively. Then there are: \[\label{GrindEQ__5_} Y=\sum \theta _{i} \left(I_{i} \cdot \Delta t\right) , \tag{5}\] \[\label{GrindEQ__6_} \theta ={\sum \theta _{i} I_{i} \mathord{\left/ {\vphantom {\sum \theta _{i} I_{i} \sum I_{i} }} \right. } \sum I_{i} } . \tag{6}\]
That is, economic efficiency is the weighted average of the efficiencies in the use of various factors. Assuming that \(\Delta t\) is a unit of time, output \(Y\) is simply a function of factor inputs \(I_{i}\) and the efficiency of their use \(\theta _{i}\), and accordingly the problem of output maximization can be described as: \[\label{GrindEQ__7_} \max Y=\sum \theta _{i} I_{i} , \tag{7}\] \[\label{GrindEQ__8_} . s.t.\sum I_{i} =I \tag{8}\]
According to the Lagrangian function: \[\label{GrindEQ__9_} L=\sum \theta _{i} I_{i} +\lambda \left(1-\sum I_{i} \right) , \tag{9}\] where \(\lambda\) is the Lagrange multiplier and the first order condition is: \[\label{GrindEQ__10_} \frac{\partial L}{\partial I_{i} } =\theta _{i} -\lambda =0 . \tag{10}\]
This leads to the necessary condition for output \(Y\) to be maximized: \[\label{GrindEQ__11_} \theta _{L} =\theta _{K} =\theta _{T} =\theta _{R} =\theta _{S} . \tag{11}\]
The above equation shows that in a regional economic system there is always a certain factor that is used with the lowest efficiency, and this lowest efficiency limits the growth of output and is the efficiency bottleneck of the economic system. When one efficiency bottleneck is eliminated, a new efficiency bottleneck emerges, so the process of economic growth is a race for efficiency in which efficiency bottlenecks are constantly identified and eliminated. In addition, even if the above equation holds, there will still be surplus in the economic system, i.e., generated by the difference between the inherent efficiency of the factors and the efficiency of their use. For example, the efficiency of the use of labor\ and capital can be improved through market regulation, and their inherent efficiency can be improved through education and improved services in the financial system.
Selection of variables: The main sources of data in this paper are the China Architecture Science and Technology Yearbook and China Statistical Yearbook of each year, as well as the statistical yearbooks and statistical bulletins of each province and city.
Explained Variables: Regional economic growth indicator (lnGDP), using the gross domestic product of each city, with 2007 as the base period, and taking the logarithm after deflating according to the GDP deflator of each province.
Explained variables: Engineering material innovation (INN), engineering material innovation the key indicator of innovation activities in this study, engineering material innovation is crucial to regional economic growth.
Regional innovation network level (NET), mainly including network size, network openness, network connection strength and network structure hole 4 aspects [20].
Policy subsidies (GOV), government subsidies for construction engineering technology, reflecting the government’s emphasis on R&D.
Physical capital (PC), measured by fixed asset investment in each region.
Engineering material technology industry agglomeration (HTIC), which is measured by using location entropy to measure the agglomeration level of engineering material technology industry, and is calculated as follows: \[\label{GrindEQ__12_} HTIC_{it}^{H} =\frac{t}{{x_{t}^{H} \mathord{\left/ {\vphantom {x_{t}^{H} x_{t} }} \right. } x_{t} } } , \tag{12}\] where, \(H\) represents the engineering materials technology industry, \({x_{it}^{H} \mathord{\left/ {\vphantom {x_{it}^{H} x_{it} }} \right. } x_{it} }\) refers to the percentage of output value of the engineering materials technology industry in the \(i\) region \(t\) year, and \({x_{t}^{H} \mathord{\left/ {\vphantom {x_{t}^{H} x_{t} }} \right. } x_{t} }\) is the percentage of output value of the national engineering materials technology industry in the \(t\) period.
Infrastructure level (INF), measured by the quantitative level of infrastructure implementation in each city.
Digital development level (DIG), measured by the total amount of regional postal, telecommunication, and courier services.
Modeling: To test the impact of innovation in engineering materials (INN) on regional economic growth (GDP), the following fixed-threshold regression model was set up [21]: \[\label{GrindEQ__13_} \begin{array}{rcl} {\ln GDP{}_{it} } & {=} & {\alpha +\beta _{1} \ln INN_{it} +\beta _{2} \ln NET_{it} } \\ {} \end{array} , \tag{13}\] where \(i\) and \(t\) are the region and year respectively, \(\alpha\), \(\beta\), \(\rho\) and \(\theta\) are the coefficients to be estimated, and \(\varepsilon _{it}\) is the random perturbation term.
In this paper, the engineering materials technology innovation variable is set to \(t+1\) periods, and existing studies have shown that the average lag between R&D investment and patent application is 1 year, and it is widely accepted in empirical studies of innovation influencing factors, and it also helps to reduce the endogeneity problem [22]. The explanatory variables are economic growth, which is represented by the national economic growth rate (\({\rm \Delta GDP}\)) and per capita economic growth rate (\({\rm \Delta GDPP}\)). The regional innovation network level NET is an industry fixed effect and FE is a province fixed effect, which is used to capture heterogeneous characteristics that do not change over time, and is used to reduce the possibility of omitting explanatory variables. In addition, time fixed effects are not controlled for in the model because GDP is a time series variable. In the robustness test, year fixed effects are added to the model and the results are unchanged.
Macroeconomic environment is the foundation of the development of the construction industry, in the face of the new economic situation, this chapter analyzes the situation faced by the engineering materials industry in urban infrastructure construction under the new economic normal from the gross domestic product and fixed asset investment, which are the two factors that have a greater impact on the innovative development of engineering materials in the construction industry.
The construction industry is a pillar industry of the national economy, while the engineering materials industry is an important part of the construction industry, and its relationship with regional economic growth is mutually causal. The engineering materials industry provides the material base for the construction industry, and the economic growth of the construction industry provides the material base for the development of the national economy, while the development of the national economy also provides the economic base for the economic growth of the construction industry. Therefore, to analyze the relationship between engineering materials industry innovation and regional economic growth, we should first analyze the state of national economic development at this stage.
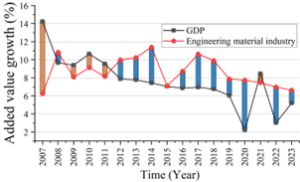
Through nearly 40 years of reform and opening up, China’s economy has undergone radical changes, the gross domestic product from 367.95 billion yuan in 1978, up to 126.1 trillion yuan in 2023, the national economy has undergone qualitative changes. People’s living standard has been improved significantly, and the industrial economy of various industries has been fully developed, and the total output value of engineering materials industry has also been raised from 18.684 billion yuan in 1980 to 153,395 billion yuan in 2023.The trend of China’s GDP and the growth rate of value added of the engineering materials industry from 2007-2023 is shown in Figure 3, which shows that, influenced by the growth rate of GDP slowdown, the growth rate of value added of engineering materials industry is also declining, and there was a big decline in 2015, from 11.41% in 2014 to 7.12%.For most of the time from 2012 to 2023, the growth rate of value added of engineering materials industry is higher than the growth rate of gross domestic product, and this phenomenon indicates that the engineering materials industry is developing well. However, in 2017, the growth rate of value added of engineering materials industry continued to decline to 6.6.%, and the economic growth of engineering materials industry urgently needs to be analyzed in depth.
Fixed asset investment is mainly used for national capital investment, expansion of reproduction, real estate investment and development and other investment, construction industry as infrastructure, housing construction industry, is the conversion of fixed asset investment into construction products, fixed assets, an important industry, fixed asset investment to promote the development of the construction industry. Related studies have all shown that when the economy grows rapidly, fixed asset investment increases, and the demand for engineering materials industry increases. On the contrary, when economic growth declines, fixed asset investment will be less, and the demand for engineering materials industry will be reduced. Relevant data show that more than 60% of fixed asset investment is used for engineering materials purchase and installation. Therefore, the situation facing the engineering materials industry can be analyzed from the perspective of fixed asset investment.
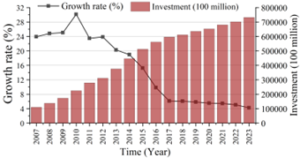
China’s fixed asset investment amount and its growth rate changes are shown in Figure 4. It can be clearly seen that the amount of fixed asset investment maintains a sustained growth, but since 2011, the growth rate of fixed asset investment has been decreasing year by year, and the growth rate of fixed investment has fallen from 30.13% in 2010 to 4.24% in 2023.
From the above analysis, it is found that after entering the new normal, the total amount of China’s gross domestic product (GDP) and fixed asset investment are both increasing. And the total amount of data is quite impressive, but their growth rate are declining, which brings external pressure to the innovation and development of the engineering materials industry. But this is also an opportunity, this new economic environment, forcing the engineering materials industry to make changes to high efficiency, low cost, environmental protection, etc., and can no longer rely on capital investment to drive growth, but should be from the transformation of the mode of economic growth, optimization of the industrial structure and other aspects to solve the development of the engineering materials industry within the face of the problem.
The diversity index of engineering materials innovation is the number of technology categories that a country can produce with relative technological advantage, i.e.: \[\label{GrindEQ__14_} DIVERSITY=K_{c0} =\sum {}_{t}^{m} M_{c,t} . \tag{14}\]
When region \(c\) is able to produce engineering materials \(t\) and the technology is superior \({\rm RCA}_{c,t} \ge 1\), then \(M_{c,t} =1\), otherwise \(M_{c,t} =0\).
The ubiquity index of engineering materials innovation refers to the number of regions that can produce a certain type of engineering materials, the more ubiquitous the technology is, the more it can be produced in more regions, the lower the threshold that needs to master the technology, and the value of its technology is relatively low. That is: \[\label{GrindEQ__15_} UBIQUITY=K_{t,0} =\sum {}_{c}^{n} M_{c,t} . \tag{15}\]
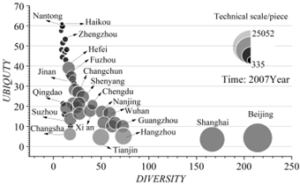
China is the country with the fastest increasing technological complexity in engineering materials, and the diversity and ubiquity of engineering materials technological innovation outputs in cities within the country deserve further dissection. Based on the diversity and ubiquity indices, the relative technology diversity and technology ubiquity levels of cities’ engineering materials invention patents based on the CNIPA database are calculated for the 2 time periods of 2007 and 2023, respectively. And scatter plots of the correlation between relative diversity and technology ubiquity are drawn for the top 1/3 of cities in terms of technology output in each period.
In 2007, the results of the evolution of the correlation between the relative diversity and ubiquity of engineering material technologies are shown in Figure 5, which shows that Beijing and Shanghai produced the most diverse engineering material technologies with the lowest overall ubiquity, and the gap with other cities is large, and the differentiation characteristics are obvious. Although Hangzhou and Tianjin have similar technology ubiquity (ubiquity index around 5) with Beijing and Shanghai at this time, the number of material technology types with competitive comparative advantage that can be produced is only about 1/3 of that of Beijing, and the engineering material technology innovation in China at this stage is mainly supported by Beijing and Shanghai.
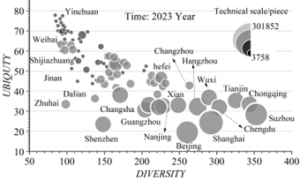
The results of the evolution of the correlation between diversity and ubiquity in 2023 are shown in Figure 6. The diversification path of engineering materials technology innovation output begins to diverge, with the growth rate of diversification in cities such as Beijing and Shanghai decreasing, and the level of technological diversification in Chengdu, Tianjin, Chongqing, and Suzhou having exceeded that of Beijing and Shanghai, becoming the four cities with the highest level of technological diversification. Engineering materials technology diversity in the increase at the same time, technology ubiquity tends to increase, such as Tianjin technology relative diversity from 56 in 2007 to 331 in 2023, technology ubiquity also increased from 6.4 to 35.6, a few cities with the opposite. The diversity index of engineering materials technology grows faster in this period, which is a key stage for increasing the quantity and quality of engineering materials technology innovation output.
Based on the threshold regression analysis model constructed in the previous section, combined with the data derived from the China Statistical Yearbook, the descriptive and correlation coefficients of each variable are obtained as shown in Table 1. The results show that the correlation coefficients between GDP and INN, NET, GOV, PC, HTIC, and INF are 0.488, 0.515, 0.352, 0.421, 0.305, and 0.618, respectively, which are significantly positively correlated (p<0.01), and the correlation coefficients of most of the control variables are significant, which indicates that the selection of control variables is more reasonable.
| Variable | N | Mean | SD | Minimum | Maximum | Correlation coefficient (GDP) |
| lnGDP | 212 | 9.982 | 0.611 | 8.152 | 11.396 | 1.000 |
| lnINN | 212 | 15.051 | 1.035 | 12.341 | 17.009 | 0.488*** |
| lnNET | 212 | 2.374 | 0.091 | 2.459 | 2.834 | 0.515*** |
| lnGOV | 212 | 4.452 | 0.833 | 2.834 | 6.946 | 0.352*** |
| lnPC | 212 | 7.694 | 0.576 | 7.351 | 6.924 | 0.421*** |
| lnHTIC | 212 | 0.988 | 0.855 | 0.152 | 10.005 | 0.305*** |
| lnINF | 212 | 9.972 | 0.809 | 8.351 | 17.038 | 0.618*** |
| lnTRA | 212 | 2.771 | 0.351 | 0.175 | 6.011 | 0.182** |
| lnDIG | 212 | 0.533 | 0.181 | 0.203 | 0.919 | 0.115* |
| Note:*p<0.1, **p<0.05, ***p<0.01. | ||||||
In this study, according to the threshold regression process, the likelihood ratio test is utilized to determine the significance of the threshold order of magnitude of its threshold effect, and then the threshold value and threshold confidence interval are further determined. This study first constructs the threshold model to explore the nonlinear effect of GOV on the positive relationship between INN and GDP. The results of threshold effect identification are shown in Table 2, which show that when the explanatory variable is INN, there is a single threshold effect of GOV at the 10% significance level, a double threshold effect at the 1% significance level, and a triple threshold effect is not significant.
| Single sill | Double sill | Triple threshold | |
| The explanatory variable was INN and the threshold variable was GOV | |||
| F value | 28.15* | 38.72*** | 10.51 |
| p value | 0.068 | 0.000 | 0.112 |
| BS | 500 | 500 | 500 |
| 1% | 37.151 | -3.451 | 21.375 |
| 5% | 30.514 | -12.068 | 14.835 |
| 10% | 26.081 | -16.551 | 12.451 |
The results of threshold estimation and confidence intervals are shown in Table 3, which shows that in the single-threshold model, the first threshold of GOV is 3.505 with a confidence interval of [3.351, 3.505], and the second threshold of GOV is 4.227 with a confidence interval of [3.558, 6.833].
| Threshold | Double threshold model | |
| First threshold value | Second threshold value | |
| The explanatory variable was INN and the threshold variable was GOV | ||
| Threshold value | 3.505 | [3.351, 3.505] |
| 95% confidence interval | 4.227 | [3.558, 6.833] |
The results of the threshold regression analysis are shown in Table 4, which shows that when the explanatory variable is INN and the GOV of a region is lower than 3.505 (about 0.031 million yuan), the impact of innovation in engineered materials (INN) on regional economic growth (GDP) is significantly positive at the 1% level. For every 1% increase in INN, GDP increases by 0.109%. The impact of innovation in engineering materials on regional economic growth (GDP) is significantly positive at the 5% level when a region’s GOV is between 3.505 and 4.227 (about 0.031-0.072 million dollars), i.e., for every 1% increase in INN, GDP grows by 0.099%.The impact of innovation in engineering materials on regional economic growth (GDP) is significantly positive at the 1% level when the GOV is greater than 4.227 (about 0.072 million dollars). GDP) is significantly positive and increases at the 1% level, i.e., for every 1% increase in INN, GDP increases by 0.112%.
| Variable | Dependent variable (InGDP) | |
| Model | T-value | |
| LnINN (lnGOV 3.505) | 0.109*** | (4.52) |
| lnINN (3.505) lnGOV 4.227) | 0.099** | (3.80) |
| lnINN(lnGOV 4.227) | 0.112*** | (3.92) |
| lnNET | 0.576*** | (3.06) |
| lnPC | 0.468*** | (10.88) |
| lnHTIC | -0.051 | (-2.34) |
| lnINF | 0.248*** | (11.59) |
| lnTRA | 0.052** | (1.61) |
| lnDIG | 0.036 | (0.89) |
| Constant | 0.108 | (0.28) |
| R2 | 0.965 | |
| F-value | 425.72*** | |
| Note: *p<0.1,**p<0.05,***p<0.01, t statistic in parentheses. | ||
The regression results show that the positive moderating effect of policy subsidies on the positive relationship between independent R&D innovation and regional economic growth gradually increases with the improvement of the level of the innovation network, reflecting that the innovation network can improve the rate of intra-regional knowledge flow, broaden the effective scope of knowledge flow, and promote the positive “recognition label” of policy subsidies, i.e. provide more favorable assessment evidence for the entry of external investment, create favorable conditions for innovation subjects to quickly obtain effective knowledge, technological resources or funds, and further consolidate their technological innovation input. The positive effect of the “recognition label” of the policy subsidy, that is, it provides more favorable evaluation evidence for the entry of external investment, creates favorable conditions for the innovation subject to quickly obtain effective knowledge, technology resources or funds, further consolidates its investment in technological innovation, and reduces the duplication of investment in technological research and development of the enterprises in the region by relying on the exchange of the innovation network to reduce the cost of technological innovation, and at the same time, the innovation network that is horizontally and vertically woven in the region and connected with the innovation network with a high density can rapidly At the same time, the innovation network with horizontal and vertical connection and high density connection in the region will rapidly disseminate the innovation achievements of enterprises in the policy-subsidized region, so as to reduce the knowledge acquisition and storage cost of the innovation subject, enhance the efficiency of resource searching, the advantage of resource integration, and form a synergistic innovation development situation, further realize the diversification of combinations of new knowledge elements across the organizational boundaries, improve the success rate of innovation, enhance the innovation capability of independent R&D of the enterprises, and promote the growth of the regional economy.
This paper establishes the theoretical analysis framework of engineering material innovation and regional economic growth from multiple perspectives, and reveals the influence mechanism of engineering material innovation on regional economic growth in a more in-depth way. There is a double threshold effect on the impact of engineering materials innovation on on regional economic growth. That is, when the local regional government support is lower than 3.505, for every 1% growth in engineering materials innovation, GDP grows by 0.109%. For every 1% growth between 3.505 and 4.227, GDP grows by 0.099%. Greater than 4.227, GDP grows by 0.112% for every 1% growth. The results provide a new perspective and comprehensive explanation for the study of engineering materials innovation-driven economic development, enriching the theoretical study of regional economic growth, and at the same time can guide the innovation practice of construction engineering materials enterprises. Meanwhile, this paper mainly adopts the relevant data of statistical yearbook to explore the influence mechanism of engineering materials innovation on regional economic growth, which belongs to statistical information. Future research can strengthen the questionnaire survey and big data analysis to further validate the conclusions of this study, in order to increase the reliability of the conclusions and the richness of the research method.