
3DsMAX, Photoshop and other auxiliary design software, to help themselves complete the design work [1,2]. This design process is a visual data system, which is mainly based on interactive computers, supplemented by visual graphic display terminals, graphic input boards, plotters and other equipment and tools, and in this way to complete the graphic data processing work [3-5]. At present, computer-aided design software has been widely used in design work, in various professions and industries, such as environmental design, industrial design, graphic design, animation design and other fields, there are specialized auxiliary design software is applied [6-8]. Professionals need to fully understand the basic concepts and content of computer-aided design software before design, so as to provide theoretical guidance for the design process, and then to accurately grasp the design content and design direction [9-12].
In civil engineering design, the application and innovation of computer-aided design (CAD) software has become an important part of the industry. CAD software, through its advanced drawing and modeling tools, provides efficient, accurate, and innovative design solutions that enable civil engineers to better plan, design, and construct various infrastructures [13-16]. Its innovativeness in its combined application with virtual reality technology, 3D printing technology, data-driven, etc., has a wide range of applications in civil engineering design, with advantages such as improved design efficiency and design quality [17,18].
Innovative point: This paper utilizes the combination of macroscopic experiments and fine mechanical modeling to develop a simulation analysis of composite material properties, taking reinforced concrete structures of common civil engineering as an example. It not only explains the intrinsic connection between each component of the composite material and the macroscopic mechanical properties, and observes the evolutionary development paths and ways within the matrix, which can fully explain its performance.
In this paper, reinforced concrete beams are firstly selected as the basic members of the experiment, and the basic properties such as carbon fiber bearing capacity, load-deflection and strain are measured by comparing the performance changes of the members before and after the addition of carbon fiber composites. Then, ABAQUS finite element software was used to simulate the performance of carbon fiber composites. Specifically, five basic ontological relationships between reinforced concrete and carbon fiber composites were constructed, finite element units of concrete, steel reinforcement and carbon fiber composites were set up, and the beam construction model was established and cell division was performed. Finally, after the validation of the finite element model, the mechanical property characteristics of the composites are analyzed in terms of several characteristics such as the size, distribution and content of carbon fibers.
Reinforced concrete structure (RC structure) is a structure in which concrete is reinforced with additional steel bars to increase the strength of concrete, and is a commonly used civil engineering structure. With the growth of building use time, the performance of many buildings is approaching its limit state, by the environment, load and other influences, the concrete will be damaged, showing cracking and other phenomena, so that the bond between the steel reinforcement, concrete and other materials in the component, shear strength, ductility, etc. will be reduced, which has a great impact on the bearing capacity of the component. Carbon fiber composites as a virtue of its lightweight, high strength, corrosion resistance and other material properties in the civil engineering structure is more and more widely used, through the addition of carbon fiber composites in the reinforced concrete structure can effectively improve the stability of the civil engineering structure, this section on the basic performance of carbon fiber composites in the civil engineering structure of the test [19].
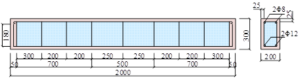
The reinforced concrete beams to be fabricated for this test had a cross sectional dimension of b × h = 200 mm × 300 mm and the length of the beam was 2000 mm. the cement was 325# ordinary silicate cement. The coarse aggregate is lime type crushed stone and the fine aggregate required for the test is medium sand with FDN water reducing agent. The concrete mix is shown in Table 1. The modulus of elasticity of the concrete poured for this test beam was \(3.03 × 10^4\) MPa.The hoop reinforcement of the concrete beam as well as its longitudinal reinforcement were all of HRB335 grade. The tensile reinforcement is 2\(\Phi\)12, compressive reinforcement is 2\(\Phi\)8, hoop reinforcement is \(\Phi\)6, and the thickness of the protective layer of concrete is 30 mm, and the reinforcement diagram of the steel bars is shown in Figure 1.
| Water | Cement | Sand | Cobblestone | FDN water reducer |
| 180 | 464 | 511 | 1248 | 2.811 |
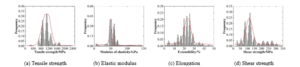
In this test, the carbon fiber cloth of SKO Sike brand, model SKO-I-300, was used, and the strength grade was high strength class I, grammage was 300g/m², and the thickness was 0.169mm.Since the width of the bottom of the beam of this test specimen was 200mm, the width of the carbon fiber material used for the test was 150mm.The performances of the carbon fiber material were tested several times, and the carbon fiber material’s The basic performance is shown in Figure 2, and (a) (d) are the frequency distributions of tensile strength, modulus of elasticity, elongation and shear strength, respectively. The tensile strength and elongation are normally distributed with the distribution intervals of 1050 1250 MPa and 19.8 27.8%, respectively, while the elastic modulus (42-53 GPa) and shear strength (177 202 MPa) are lognormally distributed to satisfy the standard values of tensile strength \(\geq\)800, elastic modulus \(\geq\)50 GPa and elongation \(\geq\)1.6%. The distribution interval of mechanical indexes of the selected carbon fiber composites meets the requirements of specification standards.
In this test, the carbon fiber cloth of SKO Sike brand, model SKO-I-300, was used, and the strength grade was high strength class I, grammage was 300g/m², and the thickness was 0.169mm.Since the width of the bottom of the beam of this test specimen was 200mm, the width of the carbon fiber material used for the test was 150mm.The performances of the carbon fiber material were tested several times, and the carbon fiber material’s The basic performance is shown in Figure 2, and (a) (d) are the frequency distributions of tensile strength, modulus of elasticity, elongation and shear strength, respectively. The tensile strength and elongation are normally distributed with the distribution intervals of 1050 1250 MPa and 19.8 27.8%, respectively, while the elastic modulus (42-53 GPa) and shear strength (177 202 MPa) are lognormally distributed to satisfy the standard values of tensile strength \(\geq\)800, elastic modulus \(\geq\)50 GPa and elongation \(\geq\)1.6%. The distribution interval of mechanical indexes of the selected carbon fiber composites meets the requirements of specification standards.
For this test, three identical concrete structural beams were fabricated according to the test requirements, where one beam without carbon fiber composites was used as the foundation beam (beam-1), the second beam was a structural beam with carbon fiber composites added directly (beam-2), and the third was loaded until the reinforcement yielded and then carbon fiber composites were added (beam-3).
Strain in reinforcement bars and carbon fiber fabrics
Before the concrete was poured, strain gauges had been pre-embedded at 1/4 of each tensile reinforcement bar, and at the mid-span position of the reinforcement bar, in order to facilitate the measurement of the tensile strain of the tensile reinforcement bar during the loading process. After the carbon fiber cloth is pasted, a strain gauge is pasted at the bottom of the fiber cloth in the span arrangement to observe the strain of the carbon fiber material.
Deflection measurement
In order to observe the deflection change of the beam during the stressing process, a displacement meter was placed at the mid-span and quarter point of the beam net span to measure the change of the beam deflection.
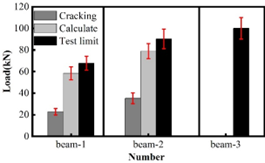
The test starts with analyzing the load bearing capacity of the beams of the civil structure and Figure 3 shows the results of the beam load bearing test. From the test results, the cracking load of the foundation beam and beam-2 is 22.81kN and 35.22kN respectively. the extreme bearing capacity of beam-1 is 67.28kN, and that of beam-2 is 90.21kN, the bearing capacity of adding carbon fiber composite material is increased by 34.08%, although it doesn’t reach the expected 40%, but the ultimate bearing capacity of the reinforced beams has already exceeded the calculated value, indicating that the paste of carbon fiber material has a relatively significant effect on improving the flexural load capacity of reinforced concrete beams. For the same kind of beams, the bending capacity of both damaged and undamaged beams is significantly increased after carbon fiber cloth is pasted. For the damaged reinforced concrete beam (beam-3) yield load is also slightly higher than the undamaged test beam (beam-2), analyze the reason may be for the beam loaded to the tensile reinforcement yield and unloaded after the beam is reinforced again after the beam is loaded, the tensile reinforcing bar of the second stress, the phenomenon of cold hardening occurs so that the yield point of the steel reinforcement compared to the test beams have a certain degree of improvement. Therefore, the load carrying capacity of the beam is also improved.
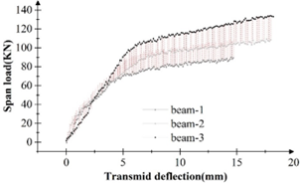
The load deflection curves of the test beams are shown in Figure 4, where the dashed portion of the graph shows the range of load deflection variation. It can be seen that the difference in deflection of the test beam is very small from the beginning of loading to the yielding stage of the beam. When loaded to about 67kN, the reinforcement of beam beam-1 started to reach yield, so its deflection growth started to increase. However, the load carrying capacity of the beam (beam-2) continues to increase and the deflection continues to increase slowly by maintaining the original rate. When loaded to 90.21kN, the beam (beam-2) begins to yield and the deflection begins to show a rapid increase. When comparing the damaged beam (beam-3) with the previous two beams alone, the load deflection curve before the yielding of the reinforcement shows a basically linear relationship, and the deflection curve does not show the same slope change as the other two at the initial stage because of the damage cracks that have already appeared in the concrete of the damaged beam. Analyzing the reason may be that the concrete in the tensile zone has been cracked and damaged, and the main bending capacity of the beam is borne by the tensile reinforcement and carbon fiber composite material, so the deflection curve shows a linear growth trend. When loaded to 90.21kN, the curve does not show a downward trend but continues to load to 100.05kN before yielding.
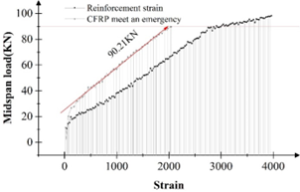
The stress-strain curves of reinforcement and CFRC in the span of the test beams are shown in Figure 5. The deformation of reinforcement and CFRC at the beginning of loading is relatively small, so the strain values at the beginning of loading do not differ much. However, as the load increases, CFRC and steel reinforcement become the main components of the flexural load of the concrete beam. At the same load, the strain of carbon fiber composites has been greater than the strain occurring in steel reinforcement, which is in accordance with the flat section assumption. When loaded to 90.21 kN, the strain gauges of the steel reinforcement overflowed and the strain of the carbon fiber changed abruptly. This is because at this point the reinforcement has yielded, thus the reinforcement withdraws from its work and the carbon fiber becomes the member that mainly carries the load. Therefore, the strains of the steel bar and the carbon fiber appear as in Figure 5.
It can be found through the above tests that the addition of carbon fiber materials in concrete can enhance the stability of civil engineering structures, this section provides finite element simulations on the performance of fiber-concrete composites in reinforced concrete member structures.
As a kind of computer-aided design software, ABAQUS is a large set of general-purpose finite element simulation software, which can solve relatively simple linear problems as well as complex nonlinear problems in engineering. It has a rich variety of cell libraries that can simulate various complex shapes. At the same time, ABAQUS rich material model library can calculate most of the typical material properties in engineering, such as composite materials, steel, metal, rubber and geological materials, etc. ABAQUS exists Abaqus/Standard and Abaqus/Explicit two solvers, the two solvers can be realized between the mutual transfer of data, and in addition, with the Abaqus/CAE front-end processing unit, it can realize the data transfer between the two solvers. Front-end processing unit, the integration of modeling, analysis, computation and result presentation is realized, which improves the work efficiency. The standard algorithm is an algorithm applicable to a variety of practical problems, which can automatically adjust the convergence of the algorithm and the step size of the calculation steps according to the characteristics of the algorithm, so as to achieve the goal of high efficiency and high precision [20].
The intrinsic relationship is a mathematical simulation of the stress-strain relationship of a material, and the constituent elements of civil engineering structures are more complex and require an intrinsic relationship for each material, which is much more complicated than that of steel. In this paper, an intrinsic model based on plasticity theory is proposed and used to describe the stress-deformation characteristics of carbon fiber concrete composites [21,22]. It allows the structure to produce hardening phenomena, volume changes, stress paths, viscosity, tensile strength, yield behavior and average pressure changes for carbon fiber concrete composites. The constants of the model are obtained from the tests of multiaxial and cylindrical axial members under different initial stresses and pressure application paths, and the use of the separated model is more reflective of the actual conditions of the members. In the separated model, there are differences in the units chosen for materials with different mechanical properties, for example, steel bars can choose triangular units and carbon fiber concrete composites can choose quadrilateral units, and the shear strength of carbon fiber concrete composites can’t be neglected, but the ratio of the length of the steel bar to the diameter is very large, and the transverse shear strength of the steel bar can be neglected.
Linear elasticity principal relationship: simply, the stress-strain curve of concrete satisfies Hooke’s law, then the concrete material is linearly elastic, and the modulus of elasticity is a constant value, the expression is as follows, which is generally applicable to the case that the plastic deformation of concrete is very small when it is compressed: \[\label{GrindEQ__1_} \sigma =E\varepsilon . \tag{1}\]
Nonlinear elasticity: the stress-strain curve of concrete is not a straight line, however, the material still remains elastic when unloaded, except that this elasticity is nonlinear, and the modulus of elasticity changes with the stress, the expression is as follows, and the practicality of this theoretical model is relatively wide: \[\label{GrindEQ__2_} \sigma =E\left(\sigma \right)\varepsilon , \tag{2}\] \[\label{GrindEQ__3_} d\sigma =E\left(\sigma \right)d\varepsilon =E_{t} d\varepsilon . \tag{3}\]
Elastic-plastic relationship: one section of the stress-strain relationship curve of concrete is a straight line, when the deformation reaches the critical state, the concrete will undergo nonlinear deformation, and the deformed structure can not be restored to the original state, which is called plastic deformation. The elastic-plastic relationship includes five simplified models, among which, the ideal elastic-plastic model and the linear reinforced elastic-plastic model are the most commonly used and have the widest scope of application, which is suitable for cyclic loading, and the specific expressions are as follows:
Ideal elastic-plastic: \[\label{GrindEQ__4_} \left\{\begin{array}{l} {\left|\sigma \right|<\sigma _{y} \varepsilon ={\sigma \mathord{\left/ {\vphantom {\sigma E}} \right. } E} } \\ {\left|\sigma \right|=\sigma _{y} \left\{\begin{array}{ll} {\varepsilon ={\sigma \mathord{\left/ {\vphantom {\sigma E}} \right. } E} +\lambda sign\sigma } & {\sigma d\sigma \ge 0} \\ {d\varepsilon ={d\sigma \mathord{\left/ {\vphantom {d\sigma E}} \right. } E} } & {\sigma d\sigma <0} \end{array}\right\}} \end{array}\right. , \tag{4}\] where: \(\lambda \ge 0\) is a parameter; \(sign\sigma\) is a mathematical symbol: \[\label{GrindEQ__5_} \sin n\sigma =\left\{\begin{array}{cc} {1} & {\sigma >0} \\ {0} & {\sigma =0} \\ {-1} & {\sigma <0} \end{array}\right. , \tag{5}\] Eq. \(\lambda \ge 0\).
Linearly reinforced elastoplastic model: \[\label{GrindEQ__6_} \left\{\begin{array}{ll} {\varepsilon ={\sigma \mathord{\left/ {\vphantom {\sigma E}} \right. } E} } & {\left|\sigma \right|\le \sigma _{y} } \\ {\varepsilon ={\sigma \mathord{\left/ {\vphantom {\sigma E}} \right. } E} +\left(\left|\sigma \right|-\sigma _{y} \right)\times \left({1\mathord{\left/ {\vphantom {1 E'}} \right. } E'} -{1\mathord{\left/ {\vphantom {1 E}} \right. } E} \right)\times sign\sigma } & {\left|\sigma \right|>\sigma _{y} } \\ {d\varepsilon ={d\sigma \mathord{\left/ {\vphantom {d\sigma E}} \right. } E} } & {\left|\sigma \right|>\sigma _{y} } \end{array}\right. . \tag{6}\]
Rheological model: This model is a new model obtained by connecting ideal elastic elements, viscous elements, and ideal plastic elements in series and then in parallel.
Internal time theory: This model integrates the nonlinear elasticity theory and elasticity-plasticity theory, abandons the way to find the yield limit load of the specimen according to the equiproportional loading, distinguishes from the inapplicability of the ideal plastic material to the concrete as well as the helplessness of the plastic mechanics to deal with the phenomenon of softening of the concrete, the internal time theory should come out, and the advantage of the model is that it is simple to conceive, easy to understand, and can simulate the complex concrete. Concrete with the following expression: \[\label{GrindEQ__7_} d\sigma =\frac{d\sigma }{E} +\sigma \frac{d_{t} }{EZ_{1} } , \tag{7}\] where \(E\) is the modulus of elasticity and \(Z_{1}\) is the parameter related to the material.
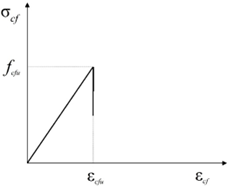
Intrinsic relationship of carbon fiber cloth: CFRC adopts linear elasticity model, and its expression is: \[\label{GrindEQ__8_} \sigma _{cf} =E_{cf} \varepsilon _{cf} \varepsilon _{cf} <\varepsilon _{cfu} . \tag{8}\]
When \(\varepsilon _{cf} =\varepsilon _{cfu}\), the value of \(\sigma _{f}\) decreases sharply, i.e., the CFRC is pulled off, and the CFRC intrinsic model is shown in Figure 6.
The ABAQUS finite element software is used for this numerical simulation analysis. In order to ensure the convergence of the model and the accuracy of the calculation, the following basic assumptions are made during the numerical simulation:
In this numerical simulation, the carbon fiber material is connected with the members by “Tie”, and the influence of secondary force is not considered.
The deformation of structural beams and columns conforms to the flat section assumption.
In this numerical simulation, crushing and other cases are not considered.
Carbon fiber concrete composites are isotropic materials, and the effect of tensile zone is not considered.
It is assumed that the steel reinforcement and CFRC used are fully elastic or fully elastic materials.
Concrete unit: The concrete unit in ABAQUS is selected as 3D solid structure C3D8R, and each node has three directions of freedom.
Reinforcing steel cell: ABAQUS selects the T3D2 cell type for reinforcing steel, and the reinforcing steel nodes also have freedom in three directions.
CFRC unit: the thickness of CFRC is much smaller than its length and width, and the thickness can be neglected. The shell unit type in ABAQUS can simulate the real shape of carbon fiber very well, so the S4D shell unit is selected for carbon fiber cloth in ABAQUS, and the line elastic relationship is used.
In order to the beam end does not produce stress concentration phenomenon during the loading process, so the mat is placed at the beam end, the size of the mat is 250mm*200mm*50mm in length*width*height, the mat unit type is a three-dimensional solid unit, and the connection between the mat and the beam is lashing.
Steps for simulating beam components
Creating component instances: When creating the component units, C3D8R solid unit is used for concrete and mat, T3D2 truss unit is used for reinforcement, S4D shell unit is used for carbon fiber cloth, and the size of the model is set to 200, which can be adjusted according to the actual demand. According to the above information of reinforced concrete beams, complete the establishment of concrete beams, reinforcement, mat and carbon fiber cloth components.
Setting material properties: In the properties module, according to the material parameters, the properties of the materials are given in turn.
Component Assembly: In this module, the components are combined into a complete component whole to form the beam member.
Setting the analysis step: In the analysis step module, the initial analysis step is the basic constraint case of the beam, and the second analysis step is the case of applied load.
Setting the constraints: In the model, the connections of each member are bound, the supports are hinged, RP1 and RP2 are set on the pads and coupled to their regions, and the load is applied at the coupling point. Reinforcement bars etc. are built into the concrete.
Setting of boundary conditions as well as loads: In this module, the loads and boundary conditions of the members are set. U2, U3, UR2 and UR2 are set to 0 in the boundary conditions. Y and Z directions need to be constrained in displacement, and X and Y direction corners need to be constrained in corner.
Mesh division: The division of the mesh is a key part of the calculation. The fineness of the mesh division plays a decisive role in the accuracy of the calculation results. The finer the mesh division is, the more accurate and effective the calculation results will be, while at the same time, the calculation time will be increased, which may lead to non-convergence of the calculation and failure of the calculation, etc. Therefore, the mesh division should not be too fine, and the calculation should be performed in the X and Y directions. Therefore, the mesh should not be too fine or too rough, and should be tested continuously to find the optimal size.
Submit the job to view the results: in the job module, add a new job and submit it, wait for the completion of the calculation to view the results.
Beam component modeling and meshing
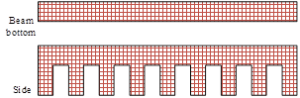
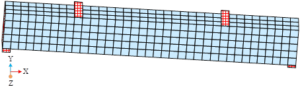
According to the above steps to create a model of the reinforced concrete beam component with carbon fiber composite material. The meshing diagram of the carbon fiber cloth component is shown in Figure 7, and Figure 8 shows the meshing diagram of the reinforced concrete beam after adding carbon fiber composite material.
The maximum value of component bending moment from finite element simulation is compared with the theoretical calculated value, and the error between the two is controlled within 5% by adjusting the parameters to ensure the accuracy and reliability of the nonlinear finite element software simulation. The theoretically calculated and simulated values for the beam are shown in Table 2. There are more reasons for the appearance of the error. The main reason for this phenomenon is that the parameter settings of the relevant substances used in the model deviate from the theoretical calculation results. In the intrinsic model of concrete and steel reinforcement, the difference between the values of the plasticity parameters of concrete and the yield strength parameter of steel reinforcement and the results of the numerical calculations resulted in a significant deviation in both the calculation of the flexural load capacity of the beam and the numerical calculations. When the carbon fiber cloth was attached, it was actually attached to the surface of the beam using epoxy adhesive. In the simulation process, this process is simplified by the method of “mutual contact”, so this is also a factor of error. In addition, the bond-slip relationship between the reinforcement and the concrete was not considered in this simulation, which to a certain extent also led to errors in the calculations, but within reasonable limits (<5%).
| Number | Theoretical calculation value (kN.m) | Finite element simulation value (kN.m) | Error |
| A1 | 101.771 | 105.308 | 0.035 |
| A2 | 116.879 | 113.251 | 0.031 |
| A3 | 132.094 | 136.841 | 0.036 |
| A4 | 147.306 | 141.600 | 0.039 |
The main focus is on the size of carbon fibers and the distribution direction in the matrix on the mechanical properties of carbon fiber concrete materials (CFRC) to expand the analysis to some extent. The compressive stress-strain curves of different types of CFRC specimens obtained by numerical calculation by changing the diameter of carbon fibers under the same volume admixture are shown in Figure 9 for the compressive stress-strain curves of two types of CFRC specimens. From the figure, it can be seen that the volume of the second type of carbon fiber mixing on the compressive stress-strain curve of CFRC specimens is basically the same as the first type of carbon fiber, and the maximum stress is about 35MPa. However, the reinforcement and toughening of concrete is not as good as that of the first carbon fiber. The reason is that when the volume mixing amount is the same, increasing the diameter of carbon fibers will reduce the number of carbon fibers at the same time, resulting in not enough carbon fibers to share the action of the load on the matrix, especially in the specimen size is small, this phenomenon will be very obvious.
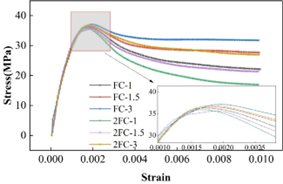
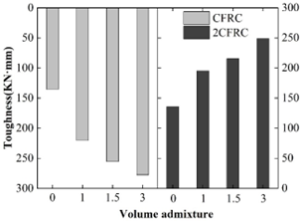
Figure 10 shows the relationship between the two types of carbon fiber admixture and the compressive toughness of concrete, from which it can be seen that the fiber admixture of 0%, 1%, 1.5% and 3% of the corresponding compressive toughness were 135.55KN·mm, 195.23KN·mm, 215.44KN·mm and 248.89KN·mm, with gains of 44.03%, 59.94% and 83.61%, respectively, which are smaller than the compressive toughness values of the first type of carbon fiber concrete at the same admixture. This is due to the reduction in the number of carbon fibers, so that its ability to effectively prevent cracks from arising and expanding in the matrix decreases, and the concrete specimens are more deformed under compressive loading.
Considering that in engineering practice, carbon fibers are randomly distributed inside the matrix, when there is a load acting on the carbon fiber concrete, the carbon fibers inside the matrix and the load direction at different angles play different roles. In order to study the influence of the distribution angle on the compressive performance of CFRC, by rewriting the fiber random distribution script in the previous paper, the numerical model of carbon fiber distribution according to 0°, 45°, 90°, and cross-crossing is established. Figure 11 shows the stress-strain curves of CFRC specimens under different distribution directions, and Figure 12 shows their corresponding peak strength comparison histograms. Combining the two figures, it can be seen that the distribution direction of carbon fibers in concrete has a great influence on the cubic compressive strength and deformation process of CFRC. The peak strength of plain concrete is 30.11 ± 1.22 MPa, and the peak strengths of carbon fibers distributed in 0°, 45°, 90°, random direction and cross-crossing are 34.45 MPa, 28.22 MPa, 38.99 MPa, 32.02 MPa, and 38.21 MPa, and the strains corresponding to the peak strengths are 1.65E-3, 2.22E-3, 1.47E-3, 2.06E-3, 1.95E-3, and 2.28E-3.
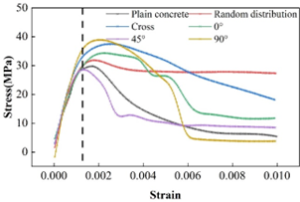
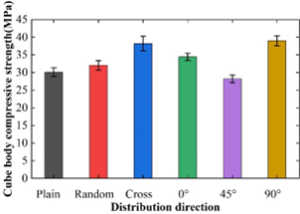
From the point of view of peak strength, the carbon fibers distributed along 90° direction and cross-crossing distribution have the largest gain on the compressive strength of concrete, but the stress-strain curve decreases very fast after the peak strength, i.e., the resistance to deformation at the stage of residual stress is very poor. 0° distribution is similar to that of 90° distribution, and the carbon fibers can only take up the tensile stress in a horizontal direction, and there is no constraint in the other direction in the same horizontal plane. In the same horizontal plane, the other direction lacks constraints, the matrix will also occur along the direction of outward expansion, and finally brittle damage occurs. 45° direction of the distribution of the negative effects, the reason may be that the distribution of the distribution along the direction can not take full advantage of the good tensile properties of carbon fibers, and secondly, it will affect the bonding between the fiber and the matrix. Inclined distribution of fibers provides space and path for crack extension, and the interface between fibers and matrix is damaged in tension rather than in shear. And random, chaotic distribution of carbon fibers for improving the compressive properties of concrete can achieve a relatively balanced effect.
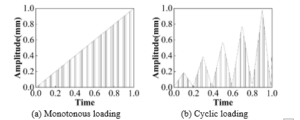
In this chapter, the HFRC fine view model is established on the basis of the carbon fiber concrete model established in the previous section, and the HFRC types are three types: steel-PVA fiber concrete, steel-basalt fiber concrete and steel-carbon fiber concrete. Since the concrete material will have strength softening phenomenon in the loading process, the displacement loading can be taken in the finite element simulation. The loading amplitude curves are shown in Figure 13, (a) and (b) are categorized into monotonic loading and cyclic loading. In this paper, with reference to the loading regime that has been set up, the loading amplitude curve versus time is set up as shown in Figure 13.
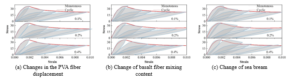
The stress-strain curves of HFRC specimens under monotonic and cyclic loading are extracted, and the monotonic loading and cyclic loading stress-strain curves are shown in Figure 14, with (a) (c) showing the changes in the dosage of PVA, basalt, and steel-carbon fiber, respectively. From the figure, it can be seen that the monotonic loading curve and cyclic loading curve of HFRC basically coincide with each other in the ascending section, and the stress values corresponding to each unloading point of the cyclic loading curve in the descending section are slightly smaller than those of the monotonic loading curve. With the increase of fiber doping, the two become closer and closer. In the cyclic loading stress-strain full curve an internal loading and unloading cycle includes an obvious unloading section and reloading section. In the initial stage, the hysteresis loop area formed under the loading and unloading curves (shaded area in the figure) is small, indicating that the energy dissipation inside the concrete is not significant. With the repetition of external loading, the hysteresis loop area increases, indicating that cumulative damage occurs within the concrete and a large amount of energy dissipation occurs. In the combination of hybrid fiber parameters, when the carbon fiber dosage was fixed and the PVA fiber or basalt fiber dosage was adjusted separately, the improvement of energy dissipation in the falling section was not obvious. When the carbon fiber dosage is changed separately, the energy dissipation in the descending section improves significantly, and the stress value corresponding to each unloading point increases with the increase of carbon fiber dosage. This indicates that high modulus of elasticity carbon fibers play a dominant role in the improvement of uniaxial and cyclic compression performance of concrete in the combination of hybrid fiber parameters.
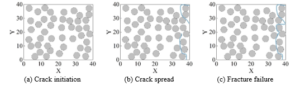
At mesoscopic scale, the transverse mechanical properties of CFRC are very complex, which are affected by many factors, including fiber content, fiber distribution, and interfacial strength. For non-round fibers, it is also affected by the shape of the fibers and the alignment angle of the fibers. Through the finite element analysis of the carbon fiber concrete model with 50% fiber content, Figure 15 shows the evolution of CFRC composites, and (a) (c) shows the evolution of transverse tensile cracks from the emergence, spreading until the fracture, in which the grey circles indicate the fibers, and the white background is the matrix, and the cracks show a continuous and zigzagging spreading path. The model tensile stress-strain curve is shown in Figure 16, when the stress reaches point A (ultimate strength) before the crack begins to sprout as shown in Figure 15(a) The presence of fibers induces a certain degree of stress concentration, and it can be clearly seen that the initial damage sprouts at the interface between the fiber and the matrix, especially in the adjacent fibers in close proximity to each other, which is prone to crack linkage, inducing expansion and a tendency to evolve into fiber-matrix interface debonding phenomenon. Since the fiber-reinforced polymer composites are brittle materials, when the stress reaches the peak, the crack begins to expand rapidly, as shown in Figure 15(b), its tensile stress begins to drop rapidly to point B. The matrix material begins to show continuity damage in the vicinity of the debonding region, and the leading edge of the crack tends to converge to the nearest weak fiber-matrix interface, and the damage interface is connected to form a continuous crack. However, during the crack extension process, the crack leading edge may encounter randomly distributed fibers, and the bridging effect of the fibers plays a certain role in hindering the crack extension, and the crack will continue to propagate around the fibers under the action of the load, which leads to the zigzagging pattern of the crack extension path and ultimately results in the complete fracture failure of the whole model as shown in Figure 15(c). It can be observed that the final failure mode is very similar to the experimental observations, providing validation for the simulation results. The model did not have an obvious yielding stage before tensile fracture occurred, and its tensile strength was 87.0 MPa, which was lower than that of the matrix material of 90.5 MPa, but the difference was not large, and to a certain extent, it also indicated that the interfacial performance between the fiber-matrix was excellent, and was not an obvious weak point compared with that of the matrix material. The performance of fiber-reinforced composites is mainly determined by the interface properties of matrix and fiber-matrix together, and the actual tensile strength of the material is dominated by the interface with lower relative performance, presenting a lower strength than that of the matrix. It is not difficult to find that the crack initiation in fiber-reinforced composites is related to the stress concentration and the spacing between the random fibers, while the form of fiber arrangement will largely affect the extension and spreading of cracks, and may even affect the fracture elongation of the material.

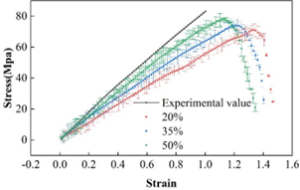
For round fibers of the same diameter, both the volume content of the fibers and the fiber arrangement affect the crack initiation and crack extension path of the material under load. Figure 17 shows the stress-strain curves of the model with different fiber contents.
The finite element analysis performance of 7.55 GPa shows good agreement with the experimental test modulus of 7.79 GPa (50% fiber content). For the model with lower fiber volume content, the obvious stress concentration caused by the proximity of fibers can be relatively alleviated. However, cracks still sprouted at the interface of two relatively close fibers and expanded rapidly along the direction perpendicular to the tensile direction. The probability of fiber proximity gradually increases with the increase of fiber volume fraction, which promotes the possibility of early crack initiation. At the same time, there is also a greater probability that fibers hindering the expansion will appear on the crack expansion path, which makes the crack expansion path undergo deflection zigzagging and slows down the crack expansion rate to a certain extent. Since the interface properties of the fiber-matrix interface do not differ much compared to the matrix strength, the reinforcing fibers can be played to a large extent under tensile loading without premature interfacial debonding. Therefore, the tensile properties of unidirectional fiber-reinforced composites are still improved with the increase of fiber content. However, the stress concentration of high fiber content composites is more prominent, and crack initiation occurs earlier, and the crack extension process in the analytical model does not encounter obvious fiber bridging obstruction, the extension path is relatively straight, and the elongation at fracture is also reduced to some extent. Therefore, the randomness of crack initiation and fiber arrangement also leads to the dispersion and variability of the transverse properties of unidirectional fiber-reinforced composites to a certain extent.
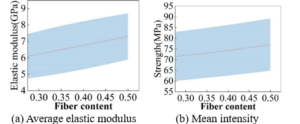
The variation of fiber content on the model properties is shown in Figure 18, (a) and (b) are the average elastic modulus and average strength, respectively, and the shaded area is the error range. Both transverse modulus and strength of unidirectional fiber-reinforced composites show an approximately linear growth with increasing fiber content, with an average growth rate of 17.22% and 5.29%, respectively. It can be seen that a relatively excellent interfacial property is a key factor to safeguard the fiber reinforcement, and if the interfacial property of the fiber-matrix is insufficient, the introduction of fibers will, to a certain extent, rather weaken its transverse mechanical properties.
For the same volume fraction of elliptical fibers, the crack initiation and crack extension paths are affected by the fiber aspect ratio and fiber arrangement. Figure 19 shows the stress-strain curves for different aspect ratio models. The in-plane principal stresses are higher in elliptical than in circular fibers, and this condition is more obvious with the increase of the aspect ratio, which may allow cracks to appear earlier. During transverse stretching, the elliptical fiber with an L/D ratio of 3.0 has the highest strength (87.3 MPa) and modulus, which is attributed to the larger specific surface area brought about by the increase in the L/D ratio, and due to the small difference in the interfacial properties of the fiber-matrix as compared to the strength of the matrix, the reinforcing fibers can be played out to a large extent under the action of the tensile load, resulting in the model with a high L/D ratio having a higher strength and modulus. However, accordingly, it is also the most prone to interfacial debonding among all the models, which may be due to the stress concentration caused by its tip affecting the bond strength between the fiber and the matrix. For poorly reinforced materials with poor interfacial properties, the larger specific surface area causes the model to fail prematurely, resulting in a reduction in both strength and toughness.
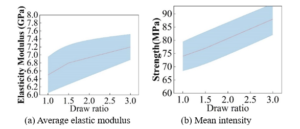
The variation of fiber shape on the model properties is shown in Figure 20, (a) and (b) for elliptical fiber reinforced composites transverse modulus and strength show linear growth with L/D ratio, respectively. The average growth rates are rates of 5.59% and 3.98%. Therefore, the trade-off between the aspect ratio and the strength and durability of the material needs to be carefully considered when designing elliptical fiber-reinforced composites to achieve the desired structural performance and reliability.

The study is based on the performance of carbon fiber composites in reinforced concrete structures in civil engineering after testing experiments, using ABAQUS calculator-assisted design software on the target finite element mesh division after finite element simulation and analysis, the performance of different carbon fiber characteristics of the performance test results were obtained.
Increasing the diameter of carbon fibers will reduce the number of carbon fibers at the same time, resulting in not enough carbon fibers to share the load on the substrate, the peak strength of plain concrete is 30.11±1.22 MPa, and the peak strength of carbon fibers when they are distributed by 0°, 45°, 90°, random direction and criss-crossing are 34.45 MPa, 28.22 MPa, 38.99 MPa, 32.02 MPa and 38.21 MPa, and the strains corresponding to the peak strengths were 1.65E-3, 2.22E-3, 1.47E-3, 2.06E-3, 1.95E-3, 2.28E-3, respectively, and the high elastic modulus carbon fibers played a dominant role in the improvement of the uniaxial and cyclic compression performance of concrete.
The progressive failure process of carbon fiber reinforced polymer composites with different contents and different aspect ratios under transverse tension was thoroughly investigated, and the phenomenon of non-uniform random distribution of fibers was studied by finite element simulation. The simulation results show that the elastic modulus of the material increases with the increase of fiber content, but the toughness decreases. The oriented arrangement of elliptical fibers in the long-axis direction of stretching has a significant increase in the elastic modulus and strength of the material, which becomes more and more obvious with the increase of the length-to-diameter ratio, while increasing the complexity of cracking.
The scope of subsequent research is extended to more types of composites or different material parameters, such as different fiber types, matrix materials, and interfacial properties, in order to adapt to a wider range of application scenarios. At the same time, explore the application of deep learning methods in the fatigue performance and impact performance of composites to extend their application in aerospace, automobile manufacturing, construction engineering and other fields.