
In the context of the rapid development of tourism, in order to provide high-quality and diversified tourism products, national and local governments attach great importance to the construction of tourism resorts. Tourism service facilities are the basic elements for the normal operation of tourism resorts, which are important factors affecting tourists’ tourism happiness [1,2]. By upgrading and improving the construction of tourism service facilities, in order to improve the service level of tourism resorts and promote the healthy and sustainable development of tourism.
Tourism service facilities are the carrier to undertake tourism reception, which refers to the facilities and conditions that provide services for tourists’ recreation, sightseeing, vacation and other activities, and are an important part of the elements of tourism activities [3]. Tourism service facilities can be divided into catering, accommodation, shopping, entertainment, transportation, sanitation and other categories according to their functions to meet the needs of the six elements of tourism, “food, accommodation, transportation, travel, shopping, entertainment” [4-7]. As one of the six elements of tourism, tourism accommodation should meet the needs of different levels, that is, to provide tourists with a choice of high-end accommodation facilities and low-end accommodation facilities, to achieve diversified development [8-10]. In the design of the building appearance as far as possible with tourism regional characteristics, architectural style should be as far as possible and the local architectural style, landscape and building group style matching, as far as possible to consider ecological and environmental protection, take the direction of low-carbon development, and promote the sustainable and healthy development of the local tourism industry [11-13]. In the accommodation should also take into account the security and privacy, in the supporting facilities should be complete, clean and neat [14-15].
Vasiliev, E. S. et al [16]. used the method of correlation dependence to analyze the impact of accommodation facilities on the development of tourism and to determine the weighting coefficients in the constructed socio-economy with the aim of improving the efficiency of implementation of projects in the field of tourism [16]. Pop, C. et al [17]. Revealed the diversified forms of combinations of accommodation planning in rural tourism in terms of types, classifications and capacities, and analyzed the advantageous types of accommodation units, dominant classifications and dominant accommodation capacities to further improve the quality of services and facilities [17]. Kruger, M. et al [18]. emphasized the importance of accommodation facilities to the tourist experience, and in analyzing the accommodation and campsite choices of tourists for a tourist attraction, found that there are huge differences in accommodation needs and preferences even among tourists with the same demographic profile [18]. Mahdi, A. et al [19]. proposed a method based on fuzzy Hierarchical Analysis and Geographic Information System (GIS) technology as a model for tourists’ accommodation decision-making, which provides tourists with personalized recommendations by weighted integration of tourists’ preferences for accommodation facilities, while indirectly promoting the improvement of accommodation facilities and improving the quality of tourism services [19]. Provotorina, V. et al [20]. analyzed the situation of rural accommodation facilities in rural tourism activities, as well as basic and additional services, and explored how the development of accommodation facilities can enhance their relevance and convenience [20]. Bradić, M. et al [21]. explored the relationship between consumer attitudes and responsibility for environmental protection in the tourism and hospitality market through qualitative and quantitative research on accommodation facilities for sustainable development with eco-efficiency [21]. Nagaj, R. took the degree of centralization of security measures in accommodation facilities as an indicator, assessed the impact of safety levels and security levels on the competitiveness of accommodation facilities, and found that the service quality of accommodation facilities was significantly and positively related to the level of safety and security [22].
The pattern optimization of the planning of accommodation facilities in tourist attractions is an important means to enhance the experience of tourists, which is conducive to the realization of the high-quality development of the service level of tourist attractions. Starting from the theory of sustainable development, this paper adopts web crawler technology to extract the visitor evaluation text of accommodation facilities in tourist attractions, analyzes the degree of agglomeration of accommodation facilities planning in tourist attractions by using the geographic concentration index, and verifies the spatial evolution characteristics of accommodation facilities in tourist attractions by combining the standard deviation ellipse. Through the TF-IDF algorithm to extract the tourists’ experience of the tourist attraction accommodation facilities planning just frequency, using the BERT model for the evaluation text word vector matrix construction, and then using the BiGRU network to extract its deep semantic features, and then to realize the construction of the tourism text emotion classification model, in order to explore the tourists’ emotional experience of the tourist attraction attitude. It provides data support for the related strategies of enhancing tourists’ experience in the planning of accommodation facilities in tourist attractions.
Tourism behavior with the overall consumer spending upgrade, tourists travel is no longer limited to visit a certain attraction scenic spots. In the context of regional tourism, the proliferation of B&Bs, inns as a new tourism accommodation products, how to improve the quality of the product in the fierce competition in the market, to guide and promote the healthy development of the new tourism accommodation industry, and effectively enhance the emotional experience of the tourists perception of the tourist attractions optimization of the accommodation facilities planning pattern of a critical issue.
Accommodation is an important pillar of the tourism industry, which, on the basis of meeting the basic residential needs of tourists, provides tourists with a more comprehensive and rich tourism experience, while extending the consumption chain of tourists and driving the economic development of regional tourist destinations. However, the conditions of some mountainous areas and rural tourist accommodations are mostly simple farmhouses with insufficient sense of design, low level of application of science and technology in the residences, poor production and life compatibility functions, and imperfect supporting facilities and public facilities. In particular, it does not integrate regional characteristics and the concept of ecotourism, and to a certain extent, it is not in line with the pace of ecotourism industry development. How to further improve the accommodation conditions, optimize the planning pattern of accommodation facilities in tourist attractions, and effectively meet the diverse needs of tourists to enhance their travel experience are the key issues that need to be resolved for the high-quality development of tourist attractions.
China’s social and economic development cannot be separated from the support of the tourism industry, and the scale of tourist accommodation facilities has also expanded rapidly with the continuous rise of the tourism industry. In the sustained economic and social development, there is a two-way role between the spatial layout of tourism accommodation facilities and tourism development. Reasonable spatial layout of tourist accommodation facilities can effectively promote the rapid development of the tourism industry, enhance the tourist experience of tourists, channel the flow of population in popular tourist spots, and alleviate the pressure of urban transportation.
Experience means that enterprises use services as the stage, goods as the props, and consumers as the center to create activities that can make consumers participate and worth remembering, as well as events that make everyone participate in them in a personalized way. Tourism experience is the process of changing the psychological structure of the tourist individual through contact with the external world, and it is a refreshing feeling of body and mind that the tourist in the tourist world obtains when he or she is deeply integrated with the current situation.
The “tourist experience” in this paper has the same connotation, except that the “tourist experience” in this paper focuses on the “socio-cultural” attributes of the tourist experience on the basis of the economic implications of the tourist experience, and refers to the “social and cultural” attributes of the tourist experience. The “tourist experience” mentioned in this paper focuses on the “socio-cultural” attributes of the tourist experience based on the economic implications of the tourist experience, and refers to the micro-tourism world situation of the tourist in the “accommodation planning pattern” of tourist attractions [23]. The cultural qualities of the scenic area reproduced in the form of symbols to taste a physical and mental one of the inner feelings, this paper explores the scope of tourist experience perception specifically covers the tourist experience of tourist attractions, accommodation facilities planning pattern of emotion, evaluation, object, pathway, intensity, depth and authenticity of a number of aspects.
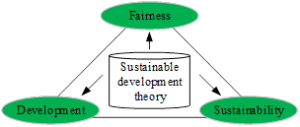
The theory of sustainable development to meet the needs of the current generation, but not to future generations to meet their needs at the same time constitute a hazard to development, it is the human race in the search for the ecological world and the natural harmonious coexistence of survival and development mode and then derived from the theory. The basic content of the theory of sustainable development is shown in Figure 1, mainly emphasizing development, continuity and equity [24]. Development includes the co-development of multiple factors, i.e., economic, social, natural and other fields. Sustainability requires a certain limit on the speed and scale of development, i.e., human use of the ecological environment should be within its carrying capacity and not exceed its maximum limit. This also requires mankind to change the long-standing practice of pursuing economic interests at the expense of the ecological environment and historical and cultural heritage, so as to leave a broader space for future generations. The principle of fairness has two main aspects: first, fairness for the current generation, i.e., horizontal fairness between generations, and second, intergenerational fairness, i.e., vertical fairness between generations.
For this reason, in the process of planning and developing accommodation facilities in tourist attractions, in order to reduce the negative impacts brought about by tourism development, original ecosystems should be maintained as far as possible, and traces of man-made operations should be reduced without destroying the simple features of the scenery, so as to optimize and promote the benign cycle of the ecosystem. In addition, it should also consider the community and residents within the scope of sustainable development, and reach a good cooperative relationship with the community for resource environmental protection, so as to realize a win-win situation between tourism development and the community.
In this study, the city of GL was selected as the case study, and a web crawler program was written in python language to capture the basic information and user comments of the accommodation facilities of tourist attractions in GL displayed on major tourism platforms on January 10, 2024 as the analysis data. After selecting user comments with more than 120 words and removing duplicate comment texts, a total of 53,266 tourist comments were finally included as sample data for the study.
In addition, the train collector software was utilized to collect accommodation data information of tourist attractions in GL city in batch. A total of more than 5,000 pieces of listing information were obtained, and the basic information of the collected accommodations included attribute information such as the title, address, room type, area, and business characteristics of the B&B. The involved GL city zoning spatial data base map data comes from the city data cluster, and the transportation trunk data comes from the GD map.
Text data pre-processing
When analyzing and processing the text data, firstly, the evaluation data of accommodation facilities in tourist attractions are processed in a general way to preliminarily screen the effective information. Second, all sentences related to the study were extracted through repeated reading and comparison, and textual information that was not relevant to the topic was deleted. Again, each relevant sentence was coded to make the primary coding close to the semantics of the original text. Each evaluation data selected needed to be more than 150 words. Meanwhile, in order to ensure the objectivity and precision of the research data, the content unrelated to this study and the repetition of semantic expressions are deleted.
Spatial data processing
Spatial data organization is an important preparatory work carried out in this study. After collecting data from different channels, the acquired spatial data need to be cleaned and calibrated, coordinate conversion, projection transformation, data correlation and a series of other processing to construct the spatial database of this study.
Firstly, duplicate data can be merged according to a certain attribute field, which can be filtered using latitude and longitude information and accommodation name, and the accommodation data with the same information can be merged. Secondly, POI data that do not meet the requirements of the research object of this paper are deleted. After that, for some data with missing information, network and telephone query are carried out to make up the information. The coordinate system of the distribution of lodging facilities in tourist attractions obtained in this paper has a certain deviation from the actual information of things, and it should be converted into a coordinate system first, and the geographic coordinates should be transformed into planar coordinates by projection, so it is also necessary to carry out a projection transformation of the spatial data after the transformation of the coordinates according to the geographic coordinates of the city of GL.
Geographic concentration index is an index to measure the distribution structure of the spatial pattern of accommodation facilities planning in tourist attractions, and the geographic concentration index can objectively reflect the concentration of accommodation facilities planning in the spatial distribution of scenic spots [25]. Its calculation formula is: \[\label{GrindEQ__1_} G=100\times \sqrt{\sum\limits _{i=1}^{n}\left(\frac{x_{i} }{T} \right)^{2} } , \tag{1}\] where \(G\) is the geographic concentration index of scenic lodging facility planning, \(x\) is the scenic lodging facility planning of the \(i\)rd source pair, \(T\) is the sum of all source pairs of scenic lodging facilities, and \(n\) is the total number of source pairs. The general value range of \(G\) is [0,100], if the value of \(G\) is closer to 100, it indicates that the spatial distribution of scenic area network attention is more concentrated, and if the value of \(G\) is smaller, it is the opposite.
The standard deviation ellipse (SDE) is a common method used to study the characteristics of the spatial directional distribution of industries, which can accurately reveal the centrality, spreading, directionality, and other aspects of the regional economic spatial distribution. The basic principle is to use the -criterion to determine the axis of the ellipse by calculating the standard deviation of the x-coordinate and the y-coordinate respectively using the mean center of the spatial elements in the study area as the starting point [26].
The \(3\sigma\)-criterion states that in a two-dimensional coordinate system, one standard deviation ellipse will cover about 68% of the elements, two standard deviation ellipses will cover about 95% of the elements, and three standard deviation ellipses will cover about 99% of the elements. The main parameters involved in the method are the long and short axes of the ellipse, the center of the circle and the angle of rotation. Among them, the long axis indicates the direction of the distribution of the spatial elements, and the longer the long axis is, the more directional the spatial elements are. The short axis indicates the distribution range of the spatial elements, and the longer the short axis is, the wider the distribution range of the spatial elements is. The center of the circle indicates the location of the center of gravity of the spatial elements, and the angle of rotation indicates the angle formed by rotating the ellipse clockwise from the north direction to the long axis of the ellipse. The area of the ellipse indicates the degree of concentration of the distribution of the spatial elements; the smaller the area, the higher the degree of concentration.
The calculation steps of the standard deviation ellipse method are generally as follows:
Determine the center of circle \((X_{G} ,Y_{G} )\), viz: \[\label{GrindEQ__2_} X_{G} =\frac{\sum\limits _{i=1}^{n}\omega _{i} x_{i} }{\sum\limits _{i=1}^{n}\omega _{i} } ;Y_{G} =\frac{\sum\limits _{i=1}^{n}\omega _{i} y_{i} }{\sum\limits _{i=1}^{n}\omega _{i} } . \tag{2}\]
Determine the angle of rotation, i.e: \[\label{GrindEQ__3_} \tan \theta =\frac{\left(\sum\limits _{i=1}^{n}\omega _{i}^{2} \bar{x}_{i} {}^{2} -\sum\limits _{i=1}^{n}\omega _{i}^{2} \bar{y}_{i} {}^{2} \right)+\sqrt{\left(\sum\limits _{i=1}^{n}\omega _{i}^{2} \bar{x}_{i} {}^{2} -\sum\limits _{i=1}^{n}\omega _{i}^{2} \bar{y}_{i} {}^{2} \right)^{2} -4\sum\limits _{i=1}^{n}\omega _{i}^{2} \bar{x}_{i} {}^{2} \bar{y}_{i} {}^{2} } }{2\sum\limits _{i=1}^{n}\omega _{i}^{2} \bar{x}_{i} \bar{y}_{i} } . \tag{3}\]
Determine the lengths of the X and Y axes, viz: \[\label{GrindEQ__4_} \sigma _{x} =\sqrt{\frac{\left(\sum\limits _{i=1}^{n}\omega _{i} \bar{x}_{i} \cos \theta -\sum\limits _{i=1}^{n}\omega _{i} \bar{y}_{i} \sin \theta \right)^{2} }{\sum\limits _{i=1}^{n}\omega _{i} ^{2} } } , \tag{4}\] \[\label{GrindEQ__5_} \sigma _{y} =\sqrt{\frac{\left(\sum\limits _{i=1}^{n}\omega _{i} \bar{x}_{i} \sin \theta -\sum\limits _{i=1}^{n}\omega _{i} \bar{y}_{i} \cos \theta \right)^{2} }{\sum\limits _{i=1}^{n}\omega _{i} {}^{2} } } , \tag{5}\] where, \((x_{i} ,y_{i} )\) denotes the position of the sample point, \(X_{G} ,Y_{G}\) denotes the horizontal and vertical coordinates of the center of the ellipse respectively, \((X_{G} ,Y_{G} )\) denotes the center of the weighted average, \(\omega _{i}\) denotes the weight, \(\vartheta\) denotes the angle of rotation of the ellipse, \(\sigma _{x}\) denotes the standard deviation of the \(X\)-axis, \(\sigma _{y}\) denotes the standard deviation of the \(Y\)-axis, and \(\bar{x}_{i} ,\bar{y}_{i}\) denotes the deviation of the coordinates from the position of the respective sample point to the center of the average, respectively.
The average nearest-neighbor index is used to portray the spatial proximity of point elements, reflecting the spatial distribution characteristics of the planning of accommodation facilities in tourist attractions as a whole, and its value indicates the average distance between each tourist attraction’s accommodation facility and its nearest-neighbor accommodation facility [27]. The calculation formula is as follows: \[\label{GrindEQ__6_} R=\frac{\bar{r}_{1} }{\bar{r}_{E} } , \tag{6}\] \[\label{GrindEQ__7_} \bar{r}_{1} =\frac{1}{n} \sum\limits _{i=1}^{n}r_{i} , \tag{7}\] \[\label{GrindEQ__8_} \bar{r}_{E} =\frac{1}{2\sqrt{n/A} } , \tag{8}\] where \(R\) is the nearest-neighbor index, \(\bar{r}_{1}\) is the actual nearest-neighbor distance, \(\bar{r}_{E}\) is the theoretical nearest-neighbor distance, \(n\) is the total number of lodging facilities in the tourist attractions included in the study, \(r_{i}\) is the Euclidean distance between the \(i\)th tourist attraction and its nearest-neighbor tourist attraction, and \(A\) is the area of the smallest outer rectangle of all tourist attractions. When \(R<1\), the lodging facilities of tourist attractions are clustered distribution, \(R>1\) is uniform distribution, and \(R=1\) is random distribution.
For evaluating the extraction of high-frequency words, this paper utilizes the TF-IDF algorithm for text vector transformation.
TF (word frequency) refers to the total number of times a word appears in the article, and IDF denotes the inverse text frequency. The word frequency can be expressed as: \[\label{GrindEQ__9_} tf_{i,j} =\frac{n_{i,j} }{\sum\limits _{k}n_{k,j} } , \tag{9}\] where \(\eta _{i,j}\) is the number of occurrences of the word in document \(d_{j}\) and the denominator is the sum of the occurrences of all words in document \(d_{j}\).
The reverse document frequency can be expressed as: \[\label{GrindEQ__10_} idf_{i,j} =\log \frac{|D|}{|\{ j:t_{i} \in d_{j} \} |} , \tag{10}\] where \(|D|\) is the total number of documents in the corpus. \(|\{ j:t_{i} \in d_{j} \} |\) denotes the number of documents containing the term \(t_{i}\) (i.e., the number of documents in \(n_{i,j} \ne 0\)). If the term is not in the corpus, it results in a denominator of zero, so in general the formula for calculating the \(1+|\{ j:t_{i} \in d_{j} \} |\) feature weights is used as: \[\label{GrindEQ__11_} TF-IDF=TF*IDF . \tag{11}\] In studying the correlation between the planning of lodging facilities in tourist attractions and the experience of tourists, this paper mainly adopts the evaluation data of tourists on lodging facilities as the research object, and then clarifies the high-frequency evaluation words of tourists on the planning of lodging facilities in tourist attractions.
In order to effectively analyze the specific strategies of planning accommodation facilities in tourist attractions in enhancing tourists’ experience, it is necessary to clarify the emotional attitude of tourists towards accommodation facilities in tourist attractions. In this regard, this paper proposes a coarse-grained tourism review text sentiment classification model (DCM-BERT), whose basic structure is shown in Figure 2, which is mainly divided into five parts, i.e., input layer, word embedding layer, deep semantic extraction layer, local feature extraction layer and output layer.
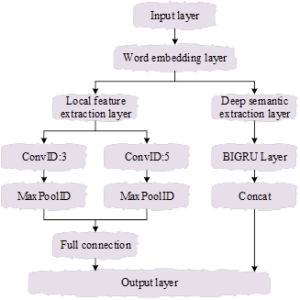
The input data of the input layer is the textual dataset of reviews of tourist attractions and lodging facilities collected in the previous section, and the role of this layer is to load the textual data of reviews of tourist attractions and lodging facilities, and then transport them to the BERT model.
The word embedding layer receives the tourist review text data loaded from the input layer, and then utilizes the BERT model to complete the vectorized representation of the tourist attraction accommodation facilities review text.
The input of the deep semantic extraction layer is the matrix of text word vectors processed by the BERT model, and the main purpose of this layer is to do deep semantic and feature extraction on the input text vectors using BiGRU network, through which the information of the context can be learned more fully.
First, the deep semantic extraction layer performs feature extraction using forward GRU and backward GRU, respectively, on the text word vector matrix \(X\) to obtain the forward hidden layer \(\vec{h}_{t}\) and the backward hidden layer \(\vec{h}_{t}\). Then, the forward hidden layer and the backward hidden layer are spliced together to obtain the output of the deep semantic extraction layer \(H,H\in {\rm R}^{n\times m\times 2\times d^{G} }\), with \(d^{G}\) representing the unidirectional GRU hidden layer dimension. The layer is computed as: \[\label{GrindEQ__12_} \overrightarrow{h_{t} }=GRU(x_{t} ,\overrightarrow{h_{t-1} }) , \tag{12}\] \[\label{GrindEQ__13_} \overline{h_{t} }=GRU(x_{t} ,\overline{h_{t-1} }) , \tag{13}\] \[\label{GrindEQ__14_} h_{t} =W_{t} \overrightarrow{h_{t} }+U_{t} \overleftarrow{h_{t} }+b_{t} , \tag{14}\] where \(x_{t}\) is the input of time step \(t\), \(W_{t} ,U_{t}\) is the forward and backward hidden layer weights, \(b_{t}\) is the bias of time step \(t\), and \(h_{t}\) is the output of time step \(t\).
The input of the local feature extraction layer is the matrix of text word vectors processed by the BERT model, and the main purpose of this layer is to use the convolution operation of the TextCNN network to do the extraction of local features between words with different distances from the input text vectors, and to get the output C of the local feature extraction layer.
The goal of the output layer is to output the model’s predicted classification results of the sentiment polarity of the text reviewing tourist attractions and accommodation facilities. This layer splices the deep sequential feature \(H\) and local feature \(c\) extracted from the deep semantic extraction layer and the local feature extraction layer to obtain the final hybrid feature \(T\). i.e: \[\label{GrindEQ__15_} T_{i} =[H_{i} ;C_{i} ] . \tag{15}\]
Then a fully connected layer is used to convert the hybrid features into the same dimensions as the sentiment categories, and then the probability \(P\) that a travel review text belongs to a positive or negative category is obtained by the Softmax function, which is calculated as: \[\label{GrindEQ__16_} P_{i} =Softmax(WT_{i} +b) , \tag{16}\] where \(T_{i}\) is the hybrid features obtained by splicing and \(W,b\) is the parameters that can be trained in this layer.
The model is trained with a cross-entropy loss function defined as: \[\label{GrindEQ__17_} loss=-\frac{1}{n} \sum\limits _{i=1}^{n}y_{i} \cdot \log \hat{y}_{i} +(1-y_{i} )\mathop{\scriptscriptstyle\leftharpoondown}\limits^{\displaystyle\rightharpoonup} \log (1-\hat{y}_{i} ) , \tag{17}\] where \(n\) is the size of the output data.
Accommodation facilities such as hotels are important windows reflecting the image and service level of tourist attractions, and analyzing the locational preference of tourists’ accommodation choices is of great significance for understanding the siting of tourist service facilities such as hotels and the characteristics of consumers’ spatial and temporal behaviors, and it also has a reference value for the spatial layout of other urban functions. This chapter is mainly based on the theory of sustainable development, deeply analyzes the spatial pattern evolution of the planning of accommodation facilities in tourist attractions, dissects the high-frequency words and emotional attitudes of tourists towards the planning of accommodation facilities in tourist attractions, and provides support for optimizing the planning strategy of accommodation facilities in tourist attractions.
YS County is a key tourist attraction concentration area in GL City, with nine major tourist scenic spots, including Li River, Yitian West Street, Ten Mile Gallery, Yulong River, Xingping Ancient Town, Fuli Ancient Town, Yangdi, Guiyang Highway, and Baili Xincun, etc. Denoted as T1 T9, the distribution of tourist accommodation facilities in the county area shows strong scenic area-dependent characteristics.
In order to further explore the spatial distribution characteristics of tourism accommodation facilities, the distribution characteristics of accommodation facilities in tourism scenic spots at three different spatial levels were analyzed from the perspective of the whole township in the county, the perspective of the key scenic spots in the county and the perspective of the key tourism scenic spots, respectively, by comprehensively utilizing the geographic concentration index. Figure 3 shows the geographic concentration index of lodging facilities in tourist attractions from 1980 to 2023.
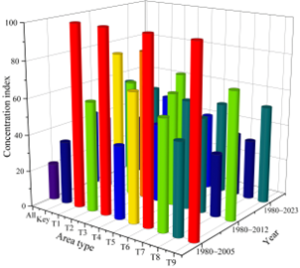
From the county-wide township spatial level, the geographic concentration index of tourist attraction lodging facilities was 20.19 in 1980 2005, while the geographic concentration index of tourist attraction lodging facilities increased to 53.72 in 1980 2023.It can be seen that the geographic concentration index of tourist attraction lodging facilities is getting bigger and bigger, which indicates that the tourist attraction lodging facilities show the trend of distribution concentration over time. From the spatial level of county key scenic spots, the geographic concentration index of tourist attraction lodging facility planning from 1980 to 2005 is 34.57, the geographic concentration index of tourist attraction lodging setup from 1980 to 2012 is 39.83, and the geographic concentration index of tourist attraction lodging facility from 1980 to 2023 is 32.36. It can be seen that the geographic concentration index rises firstly and then decreases, indicating that the Tourist attractions dependent tourism accommodation facilities in the first stage over time show a trend of distribution concentration, and then the concentration trend slows down, showing a trend of spatial dispersion. From the perspective of the spatial level of key tourism regions, the geographic concentration index of the nine key tourism scenic spots shows a spatially dispersed trend over time, and the distribution of lodging facilities in each scenic spot is relatively even.
For the evolution of the planning of accommodation facilities in tourist attractions, this paper divides accommodation facilities into three categories: luxury, comfort and economy. Utilizing the standard deviation ellipse calculation method given in the previous section, the years 2012, 2016 and 2022 are used as time nodes to explore the directionality, degree of dispersion and evolutionary trajectory of the spatial distribution of different types of lodging and to reveal the evolution of the planning of different types of lodging facilities in terms of geographic spatial distribution. Table 1 shows the statistical results of standard deviation ellipse and mean center data of different types of accommodation facilities.
| Type of accommodation | Luxury | Comfort | Economy | |
| 2012 | Longitude mean center | – | 110.492E | 110.497E |
| latitude mean center | – | 24.761N | 24.813N | |
| Length deviation | – | 0.539 | 0.062 | |
| Azimuth | – | 16.736° | 181.524° | |
| 2016 | Longitude mean center | 110.495E | 110.483E | 110.476E |
| latitude mean center | 24.804N | 24.792N | 24.789N | |
| Length deviation | 0.046 | 0.037 | 0.048 | |
| Azimuth | 176.513° | 8.924° | 4.076° | |
| 2022 | Longitude mean center | 110.486E | 110.485E | 110.484E |
| latitude mean center | 24.796N | 24.786N | 24.791N | |
| Length deviation | 0.061 | 0.037 | 0.045 | |
| Azimuth | 11.745° | 9.038° | 1.617° | |
The difference between the long and short axes of the spatial evolution characteristics of luxury-type lodging facilities increases, the short axis becomes smaller, and the azimuth angle becomes smaller, indicating that the directional and centripetal force of the luxury-type lodging facilities spreading to the surrounding area is becoming more and more obvious, and the degree of dispersion becomes smaller, and the southeast-southwest offset occurs in the junction of YS County and Xingping Ancient Town.
The mean center of comfort accommodation facilities in 2012 (110.492E, 24.761N), the difference between the long and short axes is 0.539, and the azimuth is 16.736°, and the mean center in 2022 (110.485E, 24.786N), the difference between the long and short axes is 0.037, and the azimuth is 9.038°. The difference between the long and short axes decreases and then increases, the value of the short axis increases and then decreases, and the azimuth angle decreases and then increases, indicating that the directionality and centripetal force of the diffusion of comfort lodging facilities to the periphery does not become obvious slowly, and the degree of dispersion becomes larger, and a southeast-southwest direction shift occurs in the junction of YS County and the rest of the townships.
The center of the mean value of latitude and longitude, the difference between the long and short axes, the value of the short axis, and the angle of rotation of the azimuth angle of the economic lodging facilities from 2012 to 2022 are getting smaller and smaller, indicating that the directionality of the economic lodging facilities’ diffusion to the periphery is becoming less and less obvious, and the centripetal force, on the contrary, is becoming more and more obvious, and the degree of dispersion is becoming smaller and smaller. A small movement in the southwest direction occurs at the junction of YS County and the neighboring townships in a concentric circle radial manner.
In general, it shows that the spatial development direction of economic and comfort accommodation facilities is more inclined to tourism development zones, while the spatial development direction of luxury accommodation facilities is more inclined to locations with better natural and humanistic landscapes. The planning and design of tourist accommodation settings should be carried out according to different spatial locations in order to effectively ensure that tourists get the optimal experience in tourist attractions.
The differences in the degree of aggregation of different types of lodging facilities are compared by performing the average nearest neighbor index calculation on the data of different types of lodging facilities. The degree of dispersion of accommodation facilities in tourist attractions under different time nodes is shown in Table 2, where R value less than 1 and Z value less than -2.51 indicate agglomeration, and P value less than 0.01 indicates significant results.
| Type of accommodation | Luxury | Comfort | Economy | |
| 2012 | R value | – | 1.573 | 0.482 |
| Z value | – | 3.025 | -8.514 | |
| P value | – | 0.002 | 0.005 | |
| 2016 | R value | 2.143 | 0.498 | 0.279 |
| Z value | 4.995 | -7.993 | -20.193 | |
| P value | 0.001 | 0.001 | 0.005 | |
| 2022 | R value | 0.572 | 0.259 | 0.249 |
| Z value | -6.775 | -30.127 | -35.872 | |
| P value | 0.003 | 0.005 | 0.001 | |
During the period from 2012 to 2022, the average nearest neighbor distance of luxury accommodation facilities decreases from 2,748.93m to 1,211.56m, the R-value gradually decreases from 2.143 to 0.572, and the Z-value decreases from 4.995 to -6.775, which indicates that the degree of agglomeration of the luxury accommodation facilities goes from discrete to general agglomeration, and the process of agglomeration is relatively slow.
In the spatial agglomeration characteristics of the average nearest neighbor index of comfort accommodation facilities, the R-value decreases from 1.573 in 2012 to 0.259 in 2022, and the Z-value decreases from 3.025 to -30.127. It indicates that the degree of agglomeration of the comfort accommodation facilities ranges from discrete to strong agglomeration, and that the process of agglomeration ranges from slow to strong.
The R-value of economy accommodation facilities gradually decreases from 0.482 to 0.249, and the Z-value decreases from -8.514 to -35.872, indicating that the agglomeration degree of economy accommodation facilities is from agglomeration to strong agglomeration, and the agglomeration process shows a rapid development trend.
Overall, it shows that the number of luxury accommodation facilities increased less, so the agglomeration process is slower, mainly because of the large investment and only a few companies have moved in. Comfort type and economy type accommodation facilities are mainly due to the faster development of tourism after 2016 and the influx of large amounts of foreign investment, which makes the number of both types of accommodation facilities show a rapid growth trend, the number of which has increased exponentially, so the agglomeration process is stronger.
Based on the collected evaluation data of tourists on accommodation facilities in tourist attractions, using the TF-IDF algorithm to analyze the data in terms of word division and word frequency, and then filtering the word frequency, this paper extracts the top 20 tourists’ experience evaluations of hotels and B&Bs in tourist attractions, and analyzes the differences in the tourists’ experience of the two types of accommodation facilities. Table 3 shows the statistical results of high-frequency words of tourists’ experience of different types of tourist accommodations.
| Experience of hotel facilities | Experience of civil housing facilities | ||||
| Top-20 | Word frequency | Relative frequency | Top-20 | Word frequency | Relative frequency |
| Service | 3951 | 15.65% | Room | 898 | 9.40% |
| Room | 2853 | 11.30% | Service | 824 | 8.63% |
| Clean | 1942 | 7.69% | Environment | 796 | 8.34% |
| Convenience | 1651 | 6.54% | Breakfast | 731 | 7.66% |
| Praise | 1574 | 6.23% | Landlord | 695 | 7.28% |
| Hygiene | 1462 | 5.79% | Comfort | 647 | 6.78% |
| Foreground | 1313 | 5.20% | Clean | 606 | 6.35% |
| Geographic location | 1195 | 4.73% | Landscape | 585 | 6.13% |
| Environment | 1078 | 4.27% | Position | 524 | 5.49% |
| Comfort | 1023 | 4.05% | Hygiene | 469 | 4.91% |
| Breakfast | 963 | 3.81% | Sweet | 415 | 4.35% |
| Attitude | 875 | 3.47% | Enthusiasm | 367 | 3.84% |
| Facilities | 824 | 3.26% | Balcony | 342 | 3.58% |
| Parking lot | 796 | 3.15% | Decorate | 306 | 3.20% |
| Enthusiasm | 755 | 2.99% | Attitude | 289 | 3.03% |
| Traffic | 712 | 2.82% | Convenience | 272 | 2.85% |
| Scenic spot | 648 | 2.57% | Satisfaction | 224 | 2.35% |
| Satisfaction | 606 | 2.40% | Facilities | 203 | 2.13% |
| Performance ratio | 542 | 2.15% | Grace | 184 | 1.93% |
| Neatness | 483 | 1.91% | Quietness | 172 | 1.80% |
Word frequency analysis is mainly used to reflect tourists’ attention and importance to a certain aspect of accommodation facility planning, and the higher the frequency of occurrence indicates that tourists pay more attention to this aspect and attach more importance to it. From the two groups of word frequency, the first two high-frequency words are “room” and “service”, and the word frequency is much higher than the other high-frequency words, indicating that whether choosing hotels or B&Bs, tourists are most concerned about and attach great importance to the room and service aspects of accommodation. The analysis of relative frequency shows that the relative frequency of “service” is 15.65% and that of “room” is 11.30%, with a difference of 4.35 percentage points, which is very obvious and fully reflects that the main experience of tourists on hotel accommodation lies in service, service and accommodation. The difference is very obvious, fully reflecting the fact that the main experience of tourists on hotel accommodation lies in the service, and the service is the most important factor affecting tourists’ hotel accommodation. In contrast, the relative frequencies of “room” and “service” in B&B are 9.40% and 8.63% respectively, the difference between the two relative frequencies is not very obvious, but it also shows that tourists’ experience of B&B lodging mainly lies in the room.
From the viewpoint of the nature and advantages of the two different types of accommodation, the hotel is essentially to provide accommodation services, and its advantage is to provide standardized and regulated services, so the hotel service has always been the key to the success of the hotel, and is also the most important factor affecting tourists’ satisfaction with the hotel. While the B&B is essentially the use of spare rooms, to create a different accommodation experience for tourists from the hotel, and its advantage lies in the personalized accommodation, thus the personalized room becomes the most important attraction of the B&B, and is the most important factor for tourists’ accommodation experience of the B&B.
Tourist experience sentiment analysis mainly analyzes the psychological feelings and emotional reactions of tourists to tourist attraction accommodation facilities after traveling, which are mainly classified into positive, neutral and negative emotions. Based on the coarse-grained tourist attraction accommodation facilities emotion classification model given in the previous section, the tourists’ review data are used as inputs to obtain the percentage of tourists’ emotional attribution to different tourist attraction accommodation facilities as shown in Figure 4.
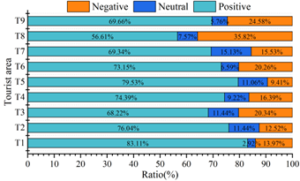
From the figure, it can be seen that tourists have the highest proportion of positive emotions for the planning of accommodation facilities in tourist attractions, and the mean value of the proportion can be up to 72.23%, and the tourists have a high overall fondness for the planning of accommodation facilities in tourist attractions, in which the tourists who show positive emotions think that the accommodation is in good condition, the scenery is beautiful, the mountains and the water are beautiful, the air is fresh, the transportation is convenient, and they linger on, and so on. Tourists can not only enjoy the beautiful natural scenery and characteristic landscape in the tourist attractions, but also relax, relieve stress and cure fatigue in the accommodation facilities. Typical negative feelings of tourists are mainly manifested in the lack of tourism carrying capacity, in holidays, weekends or peak seasons of tourism accommodation facilities can not withstand the demand of a large number of tourists, beds are tense, hygiene conditions are degraded, and the waiting time for food and beverage is too long and other problems. There are also problems such as unreasonable prices charged by accommodation facilities, poor service quality, few recreational activities and lack of tourist participation. On the whole, tourists’ perception of the experience of planning accommodation facilities in tourist attractions is positive.
This paper takes the visitor evaluation data of tourist attraction lodging facilities in YS county of GL city as an example, and analyzes the spatial planning characteristics of their lodging facilities by using the geographic concentration index, standard deviation ellipse, and nearest-neighbor index, and analyzes the tourists’ emotional experience of the tourist attraction lodging facilities by combining with the emotional classification model.
From the county-wide township spatial level, the geographic concentration index of tourist attraction lodging facilities increases from 20.19 in 1980 to 53.72 in 2023. it indicates that the geographic concentration index of tourist attraction lodging facilities is getting bigger and bigger, and the tourist attraction lodging facilities show a tendency of distribution and concentration over time.
There are obvious differences in the spatial development of accommodation facilities in different types of tourist attractions. The directionality of economy-type accommodation facilities planning to spread to the periphery becomes less and less obvious, the centripetal force instead becomes more and more obvious, and the degree of discrete becomes smaller, while the degree of discrete becomes bigger gradually in the planning of comfort-type accommodation facilities.
The Z-value of the accommodation facilities of luxury, comfort and economy tourist attractions is less than -2.51, the number of accommodation facilities in tourist attractions shows a rapid growth trend, and the overall clustering characteristics are more obvious.
There are differences in tourists’ experience of different types of accommodation facilities in tourist attractions. In hotels, the relative frequency difference between “service” and “room” is 4.35 percentage points, while there is only a 0.77 percentage point difference in B&Bs. More than 70% of tourists have a positive attitude towards the experience of accommodation facilities in tourist attractions.
Accommodation facilities in tourist attractions are mainly of the types of B&Bs, resort hotels, camping sites, etc., which can meet the accommodation needs of tourists with different needs. Based on the spatial evolution trend of accommodation facilities planning in tourist attractions and the results of tourists’ emotional experience, the following strategies for accommodation facilities planning in tourist attractions are proposed:
For lodging facilities of B&B type, which are mainly reconstructed and expanded from the original residential houses, attention is paid to the protection of the original architectural style in the process of reconstruction and expansion, and more materials such as timber and bamboo are utilized for the reconstruction. Attaching importance to the creation of the exterior landscape of the B&B, the exterior of the B&B can be planted with bamboo, flowers and plants, and configure facilities such as pavilions to enhance the landscape. In the decoration of the interior of the B&B, handicrafts are utilized for decoration, while the local vernacular culture is applied to the interior decoration.
For hotel-type accommodation facilities, site selection for resort hotels covers a large area, should choose the terrain is more open area, combined with the topography, according to local conditions for construction. Resort hotels, in addition to the accommodation function, other functions and facilities, should be combined with the characteristics of tourist attractions, local culture and tourism resources to set up. The hotel building should not use large volume of buildings, it is appropriate to use a small volume of building groups group layout, the architectural style and bamboo forest landscape coordination, in the tone of gray, cyan, white-based, the material is mostly used in the green brick, stone, wood, bamboo and so on. The external landscape of the hotel is coordinated with the building to create a high-class and private atmosphere of the resort hotel.
For campsite type accommodation facilities, the campsite should be selected in a zone with a gentle internal slope, open space and low tree depression. Campsites should be equipped with complete infrastructure, such as toilets, electrical systems, water supply systems, drainage systems, road systems and so on. Camping sites can set up service facilities such as camping platforms and tent rental points for tourists to camp.
Based on the results of the analysis of spatial distribution and tourists’ emotional experience in the planning of lodging facilities in tourist attractions, this paper puts forward the following suggestions to enhance the tourists’ experience of lodging facilities in tourist attractions.
Utilize idle resources through leasing, replacement and other ways, and promote the development of lodging by remodeling abandoned buildings, ancient dwellings, idle, houses and so on. In addition, the relevant departments should encourage enterprises and individuals to actively invest in the construction of B&Bs, and utilize idle houses to operate B&Bs, thus guaranteeing the orderly development of B&Bs. At the same time, it should also strengthen the effective use of natural resources, cultural relics and monuments in tourist attractions, create relevant theme lodging, and use modern technology to improve the service quality of lodging, and further promote the sustainable development of lodging.
Enrich the sequence of lodging products, gradually forming a series of reception facilities such as standardized hotels, social guesthouses, characteristic lodgings, theme lodgings, and ecological log cabins, and gradually launching new types of leisure such as automobile camps and tent camps. Setting a threshold value for the size of guesthouses, the near future focuses on the development of theme B&Bs and characteristic B&Bs, while the planning for the long term mainly focuses on comprehensively upgrading the service level of the lodging industry and developing characteristic lodging and reception facilities. Relying on the many characteristic rural resources, develop different grades of B&B reception facilities.
Improve the layout of service reception facilities, develop standardized hotels and characteristic B&Bs centered on tourist attractions, optimize the lodging structure and optimize the structure of lodging facilities in the management areas of tourist attractions based on the development principles of steady upgrading, continuous adjustment, and new construction in due course, so as to form a tourist lodging system that is full-featured, reasonably laid out, and combines high school with low grade.