
With global climate change and increased awareness of environmental protection, green and low-carbon development has become an important trend in all industries around the world. As an important source of energy consumption and carbon emission, the building construction industry is facing the urgent need for transformation and upgrading.
As a rapidly developing field in recent years, the application of digital technology in the building construction industry not only changes the traditional construction methods, but also provides new possibilities for realizing the green and low-carbon goals of the industry [1,2]. Exploring ways to enhance the efficiency of architectural forms on the use of materials as well as reducing energy consumption and guiding the realization of low-carbon structures are the goals pursued by designers [3,4]. In the past, architects have been pursuing various free explorations of architectural forms in the field of hand-drawing, and digital technology has further helped architects to develop architectural forms freely within a controlled range by standardizing the details [5-8]. For engineers, digital technologies help them to calculate the forces in free-form structures in order to determine the safe sizing of the components [9,10]. For builders, digital technology helps them to understand the building shape more clearly, which is conducive to the smooth progress of construction.
And the digital technology represented by VR technology can calculate the total carbon footprint of the building and reduce the carbon emission of the building by reducing the consumption of building materials in efficient forms or parameterized flow forms [11,12]. This economic analysis of the building structure, i.e. the analysis of the maximum sources of energy consumption, will be given more importance in the building design phase [13,14].
Lin et al. [15] used virtual eye-tracking to assess users’ affective preferences in architectural landscape design, and VR-based affective preference analysis can help low-carbon design in the construction industry because of the correlation between the color of building materials and carbon emissions. Zhaoyi et al. [16] introduced light sensing technology to provide intelligent, low-carbon and highly efficient thermally optimized design for buildings, where building designers are able to rely on visualization tools such as heat flow and distribution of buildings under virtual reality image scene reconstruction technology. Houlihan Wiberg et al. [17] showed that virtual reality technology for dynamic, interactive visualization and analysis of complex data such as architectural project planning can deepen the involvement of stakeholders in the design process. Sui et al. [18] illustrated the role played by BP neural networks and VR modeling in evaluating the energy efficient design of residential building maintenance structures, the BPNN algorithm to identify the heat transfer coefficients of the building maintenance structure, and the VR technique to model the building in three dimensions in order to evaluate the energy efficiency performance of different energy efficient envelopes. Samarasinghe et al. [19] designed and realized a VR model of sustainable civil construction to make users accept low-cost, recyclable and highly functional dwellings in civil environments through exhibitions and explanations. kamari et al. [20] analyzed a methodology for evaluating architectural design solutions that combines building information modeling (BIM), costing software, and virtual reality to understand and perceive the impact of cost and sustainability on architectural design projects. Potseluyko et al. [21] proposed a framework for house assembly including BIM, gamification and virtual reality applications, a gamification platform service in combination with BIM can simplify the process of data delivery to the user, and the VR House Configurator automatically calculates the corresponding metrics in the furniture library. Dabaieh et al. [22] investigated the application of virtual reality technology in the design and development of eco-cyclic housing as a new methodology for evaluating passive and eco-cyclic systems of housing to promote the design of houses to achieve the 9 zeros goal.
This paper first provides an overview of the preparation of rendering data, data structured grid generation, material system in rendering engine, and real-time photorealistic rendering technology in the context of VR technology in the interior visualization design system of residential houses. Then the scenes of VR technology in the perception of Hainan’s residential landscape are screened, and the influence of gender, education and professional background on the perception of residential landscape is analyzed. Finally, the application effect of VR technology in Hainan rural residential design is compared and analyzed, and the superiority of VR technology applied to Hainan rural residential interior decoration program design is concluded to provide a reference for green and low-carbon interior program design.
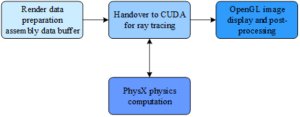
The flowchart of the visualization system is shown in Figure 1, which shows that before handing over to CUDA for ray-tracing rendering and physics computation, the system must pre-process the scene model data, including BREP model meshing (Meshing), scene optimization, material and texture assembly, lighting and camera model configuration.
Triangulation of scattered point cloud data [23,24] is the process of interpolating or approximating the surface where the data points are located, for a scattered set of sampled points obtained using 3D measurement and scanning equipment. The correct topological connections between the data points are reconstructed to obtain a triangular mesh model that is topologically similar to the original object surface. The triangular mesh processing of the point cloud is the basis and the most important step for surface reconstruction. Therefore it is widely used in the fields of surface construction by interpolation of scattered data, computer vision, reverse engineering, and 3D data field visualization. The following is the field function method in a typical triangular network algorithm.
Hoppe’s Surface Reconstruction from Unorganized Points is a typical representative algorithm based on distance field isosurface extraction. The directed distance field \(f\left(p\right)\) from a point to an object surface in 3D space is constructed from an initial set of scattered data points, and the output mesh of the scattered point set is obtained by polygonizing the zero-equivalent surface \(f\left(p\right)=0\) of this distance field. Note that this acquisition of the zero-equivalent surface is obtained using an approximation method rather than by interpolation, and thus the final reconstructed mesh model is obtained by resampling the zero-equivalent surface.
The main steps of the Hoppe algorithm are:
Tangent plane estimation
The tangent plane \(Tp\left(p_{i} \right)\) at each sampling point \(p_{i}\) is determined out of the center point \(o_{i}\) and the unit normal vector \(n_{i}\). The center point and normal vector of the tangent plane \(Tp\left(p_{i} \right)\) can be determined out of the \(K\) neighboring points at point \(p_{i}\). If the set of \(K\) neighboring points at the marked point \(p_{i}\) is \(Nbhd\left(p_{i} \right)\), the center point \(o_{i}\) is the center of gravity of the set of \(Nbhd\left(p_{i} \right)\) points. The unit normal vector \(n_{i}\) can be obtained by principal element analysis, i.e., the covariance matrix of \(Nbhd\left(p_{i} \right)\) is calculated.
The unit eigenvector corresponding to its smallest eigenvalue is the unit normal vector of the sampled points at that location.
Definition of directed distance field
Any sampling point \(p\), find some tangent plane \(Tp\left(p_{i} \right)\) such that its center point \(o_{i}\) is closest to \(p\). The directed distance field can be defined as the directed distance between a point \(p\) and its projected point on the tangent plane \(Tp\left(p_{i} \right)\), i.e: \[\label{GrindEQ__1_} f\left(p\right)=dist_{i} \left(p\right)=\left(p-o_{i} \right)n_{i} . \tag{1}\]
Sampling step cubic contour line extraction algorithm resampling distance field \(f\left(p\right)\)
Mesh Optimization
The initial mesh is dense and often contains many unwanted creases and undulations, which require further optimization. An energy function is defined to represent the relationship between the approximation accuracy and the number of nodes contained in the mesh, and the energy function is minimized by adding or deleting points, moving the position of points, or changing the mesh connection relationship under the condition of no topological change, so that the precise mesh surface can be created under the premise of satisfying the accuracy. Expression Forms.
The time complexity of this algorithm is determined by tangent plane finding, \(K\) nearest neighbor point finding and step cubing algorithm, the time complexity of the whole algorithm is \(O\left(nK\right)\), which has some effectiveness in practical applications, and the algorithm adopts approximate rather than interpolated meshing algorithm, which can effectively remove the noise points to a certain extent, but it will lose some data point information, and it is not suitable for dealing with point cloud data of any sampling density and point cloud models with sharp features such as thin walls and boundaries. , boundaries and other sharp features of the point cloud model.
The point cloud adaptive denoising strategy is based on \(K-\)neighborhood finding to establish local topological connectivity between the scattered point clouds, and adopts Gaussian influence function to estimate the influence of the current data point on its surrounding \(K\) neighborhood points, so as to \(i\) limit the noise and eliminate the drifting points.
The key of the denoising strategy is to determine whether a data point \(p_{i}\) is a noise point or not by calculating the influence of the data point \(p_{i}\) on its surrounding neighboring points, which is combined with a Gaussian influence function in this algorithm to estimate the influence of each data point \(p_{i}\) on its surrounding \(K\) neighboring points.
Let the set of \(K\) nearest neighbor points of data point \(p_{i}\) be \(Nb^{A} \left(p_{i} \right)=\left\{p_{j} \right\}_{j=1}^{k}\), then the influence value of data point \(p_{i}\) can be calculated by Eq. (2): \[\label{GrindEQ__2_} D\left(p_{i} \right)=\frac{1}{k} \sum _{l=1}^{k}e^{{-\left\| p_{i} -p_{1} \right\| ^{2} \mathord{\left/ {\vphantom {-\left\| p_{i} -p_{1} \right\| ^{2} 2\sigma ^{2} }} \right. } 2\sigma ^{2} } } . \tag{2}\]
If this influence value is greater than the set arithmetic value \(\xi\), the data point is considered to have a greater influence on the surrounding neighboring points and is retained; otherwise, the point is considered to be a noise point and is removed. It can be seen that the two more important parameters in the algorithm \(\sigma\) and with, and the choice of these two involved will directly affect the effect of denoising.
The selection of \(\sigma\): Determined by using a multiple of the average distance between two neighboring points in the original point cloud \(\sigma\). The average distance between neighboring data points is calculated \(D\_ mean\): \[\label{GrindEQ__3_} D\_ mean=\frac{1}{n} \sum _{i=1}^{n}\frac{1}{k} \sum _{p_{j} ,Ni\left(p_{i} \right)}\left\| p_{i} -p_{j} \right\| . \tag{3}\]
Then \(\sigma =c\times D\_ mean\), where \(c\) can take different values according to the actual situation, and the denser the original point cloud data points, the smaller the optimal value of \(c\) should be.
The choice of \(\xi\): When the value of \(\sigma\) is determined, the impact value of each data point can be calculated, and the choice of \(\xi\) still needs to be based on the principle of adaptive, so that it takes a multiple of the average impact value of all data points \(\overline{D\left(P\right)}\). Experiments show that when \(\xi =0.4\overline{D\left(P\right)}\) when the effect is better.
The local sampling density of the data points is calculated, given the point cloud model \(P=\left\{p_{i} \right\}_{i-1}^{N}\), \(p_{i} \in R^{3}\). The Kd-tree structure of this point cloud model can be built and the \(K-\) neighboring points \(Nb^{k} \left(p_{i} \right)=\left\{p_{j} \right\}_{j-1}^{k}\) of each data point \(p_{i}\) are calculated.
A Gaussian function is introduced as a distance weighting function to calculate the local sampling density of each data point \(p_{i}\), at which point the local sampling density at \(p_{i}\) can be defined as: \[\label{GrindEQ__4_} Density\left(p_{i} \right)=\frac{1}{k} \sum _{j=1}^{k}e^{{-\left\| p_{i} -p_{i} \right\| ^{2} \mathord{\left/ {\vphantom {-\left\| p_{i} -p_{i} \right\| ^{2} 2\sigma ^{2} }} \right. } 2\sigma ^{2} } } , \tag{4}\] where \(\sigma\) may be set to \(c\) times the average distance \(D\_ mean\) between two neighboring points in the point cloud. \[\label{GrindEQ__5_} D\_ mean=\frac{1}{n} \sum _{i=1}^{n}\frac{1}{k} \sum _{p_{1} }\sum _{Nb\left(p_{i} \right)}\left\| p_{i} -p_{j} \right\| . \tag{5}\]
The value of \(c\) can be adjusted by the user according to the actual situation, usually the denser the point cloud data, the smaller the optimal value of \(c\) should be.
In a rendering engine, a material reflects the light scattering properties of an object’s surface, while for a physics engine, a material reflects other physical properties of an object, such as mass, density, and so on. The material must be able to reflect the physical properties of a variety of real-world materials commonly used in interior design with basic accuracy.
Given a geometry and a rendering normal direction, Material is responsible for finding the corresponding BSDF and calculating how much of the light incident in direction \(\omega _{t}\) will be reflected in direction \(\omega _{o}\). A BSDF consists of one or more BxDFs, with the specific BxDF classes BRDF and BTDF describing the reflection and refraction properties of a point on the surface of an object, respectively. Scattered light is subdivided into three types: diffuse, glossy, and highlight, so that one BxDF can deal with a variety of light scattering characteristics of different material surfaces. The light scattering characteristics of an object surface bi-directional reflectance distribution function (BRDF) [25,26], the algorithmic process is as follows:The bidirectional reflectance distribution function (BRDF) is defined as the ratio \(f_{r}\) (in units of \(sr^{-1}\)) of the reflected luminance \(dL_{r}\) (in units of \(W\cdot m^{-2} \cdot sr^{-1} \cdot nm^{-1}\)) of a target in a certain direction \(\left(\theta _{r} ,\phi _{r} \right)\) to the illuminance \(dE_{i}\) (in units of \(W\cdot m^{-2} \cdot nm^{-1}\)) in the incident direction \(\left(\theta _{i} ,\phi _{i} \right)\).
The BRDF expression is: \[\label{GrindEQ__6_} f_{r} \left(\theta _{i} ,\phi _{i} ;\theta _{r} ,\phi _{r} ;\lambda \right)=\frac{dL_{r} \left(\theta _{i} ,\phi _{i} ;\theta _{r} ,\phi _{r} ;\lambda \right)}{dE_{i} \left(\theta _{i} ,\phi _{i} ;\lambda \right)} . \tag{6}\]
Reflected luminance is the radiant flux situation per unit steradian angle as well as area in the direction of reflection, as in Eq.(7): \[\label{GrindEQ__7_} L_{r} \left(\theta _{i} ,\phi _{i} ,\theta _{r} ,\phi _{r} ,\lambda \right)=\frac{d\phi _{r} \left(\theta _{i} ,\phi _{i} ,\theta _{r} ,\phi _{r} ,\lambda \right)}{dA\cos \theta _{r} d\omega _{r} } \left({W\mathord{\left/ {\vphantom {W \left(m2\times sr\right)}} \right. } \left(m2\times sr\right)} \right) . \tag{7}\]
Incident illuminance is defined as the radiant flux per unit area in the direction along which the light is incident, as in Eq. (8): \[\label{GrindEQ__8_} E_{i} \left(\theta _{i} ,\phi _{i} \right)=\frac{d\phi _{i} \left(\theta _{i} ,\phi _{i} \right)}{dA} \left({W\mathord{\left/ {\vphantom {W m^{2} }} \right. } m^{2} } \right) . \tag{8}\]
\(dL_{r}\), \(dE_{i}\) are infinitesimal quantities, which requires that the detector be able to present an infinitesimal field of view. It is just that when the measurements are actually performed, the field of view used by the detection device corresponds to definite values, and the average value of the BRDF obtained in the range of the detector’s field of view is shown in Eq. (9): \[\label{GrindEQ__9_} f_{r} \left(\theta _{i} ,\phi _{i} ;\theta _{r} ,\phi _{r} ;\lambda \right)\approx \frac{L_{r} \left(\theta _{i} ,\phi _{i} ;\theta _{r} ,\phi _{r} ;\lambda \right)}{E_{i} \left(\theta _{i} ,\phi _{i} ;\lambda \right)} . \tag{9}\]
Angularly resolved scattering (ARS) is the relationship between the ratio of the scattered light \(\Delta P_{s}\) to its incident light \(P_{1}\) in the range of a particular scattering angle \(\Delta \Omega\), as in Eq. (10): \[\label{GrindEQ__10_} ARS\left(\theta _{s} \right)=\frac{\Delta P_{s} \left(\theta _{s} \right)}{\Delta \Omega _{s} P_{i} } , \tag{10}\] where \(P_{i}\) is the incident optical power, \(\Omega _{x}\) is the unit scattering steric angle, and \(\theta _{A}\) is the angle between the scattered light and the surface normal on the sample surface.
The ARS measurement method is to analyze the sample surface parameters and its scattered light by using the measured intensity of the scattered light and its distribution. And the surface scattering of the sample is directly proportional to the surface roughness. The relationship between BRDF and ARS is given below. From the above Eqs (9) and (10) we can see that the angle-resolved scattering is actually a bidirectional reflection distribution function. \(BRDF\left(\theta _{x} \right)\) and \(ARS\left(\theta _{s} \right)\) there exists a relationship as shown in Eq. (11): \[\label{GrindEQ__11_} BRDF\left(\theta _{s} \right)=\frac{\Delta P_{s} \left(\theta _{s} \right)}{\Delta \Omega _{s} P_{i} \cos \theta _{s} } =\frac{ARS\left(\theta _{s} \right)}{\cos \theta _{s} } . \tag{11}\]
According to the definition of BRDF, it can be clearly understood that, with the help of the incident light on the surface of the object and the measurement of the light intensity of the scattered light will be able to obtain the bidirectional reflectance distribution function of the function, and then refer to the function obtained to infer the existence of the characteristics of the surface of the object information. Currently, there are many different BRDF models developed, and the content of the specific scattering analysis is also different, and the application scope in practice is unique. The next section describes the commonly used BRDF models:
Specular reflection
This model can well realize the analytical description of the reflected energy of the incident beam irradiated to the ideal form of the smooth surface layer, only the reflected energy in the range of mirror reflection direction \(\left(\theta _{i} ,\phi _{i} +180{}^\circ \right)\) does not show zero, the rest are equal to the case of zero. Namely: \[\label{GrindEQ__12_} f_{r} \left(\theta _{i} ,\varphi _{i} ,\theta _{r} ,\varphi _{r} \right)=\frac{\rho \left(n,k,\theta _{i} \right)}{\cos \theta _{r} } \cdot \delta \left(\theta _{r} -\theta _{i} \right)\cdot \delta \left[\varphi _{r} -\left(\varphi _{i} +180^{-} \right)\right] , \tag{12}\] where \(\rho \left(n,k,\theta _{i} \right)\) – corresponds to the characterization of the reflectivity presented by a smooth surface, \(\delta\) – corresponds to the characterization of the Kronecker function. This model can be very good for the ideal form of specular reflection object surface to complete the analysis and description.
Diffuse reflection
This model is able to describe and analyze in detail the bi-directional reflection in the case of ideal diffuse reflection, which is generally referred to as the Lambert model. At this time, the BRDF will not change due to changes in the scattering angle, it is assumed that all directions of the reflected light intensity value is the same, that is: \[\label{GrindEQ__13_} f_{r} \left(\theta _{i} ,\varphi _{i} ,\theta _{r} ,\varphi _{r} \right)=\frac{\rho _{d-h} \left(n,k,\theta _{i} \right)}{\pi } , \tag{13}\] where \(\rho _{d-n} \left(n,k,\theta _{i} \right)\) – characterizes the directional hemispherical reflectance presented by the diffuse reflective surface.
The model can also be considered as an ideal model, but it can be well used in practice, and many subsequent models have been refined and upgraded on the basis of this type of model. The model composition can be linearly characterized with reference to the diffuse reflection component and the directional reflection component.
Minnaert model \[\label{GrindEQ__14_} f_{r} \left(\theta _{i} ,\varphi _{i} ,\theta _{r} ,\varphi _{r} \right)=\frac{\rho _{o} }{\pi } \left(\cos \theta _{i} \cos \theta _{r} \right)^{t-1} \left(0<k<1\right) . \tag{14}\]
In Eq. (14), \(k\) corresponds to the characterization of the blackness parameter, which can well demonstrate the difference between the Minnaert model and the Lambert model. When \(k=1\) is the case, the Minnaert model can be well transformed to obtain the Lambert model.
Rayleigh-Rice model
PSD can well realize effective statistical analysis of the roughness situation, with reference to the Rayleigh perturbation principle explicitly obtained, the BRDF will be associated with the PSD function, namely: \[\label{GrindEQ__15_} f_{r} \left(\theta _{i} ,\varphi _{i} ,\theta _{i} ,\varphi _{r} \right)=\frac{16\cdot \pi ^{2} }{\lambda ^{4} } \cdot Q\cdot \cos \theta _{i} \cdot \cos \theta _{r} \cdot PSD . \tag{15}\]
In Eq. (15), \(Q\) characterizes the variables that can affect the surface reflectance. This model can be applied in a small country, and can only be used to measure and analyze objects with very low roughness.
Phong model
This model is a luminance model constructed with reference to the actual reflection characteristics, and does not have a specific physical characterization. This model of light form plays a key role in computer graphics research. \[\label{GrindEQ__16_} f_{r} \left(\theta _{i} ,\phi _{i} ,\theta _{r} ,\phi _{r} \right)=\frac{k_{d} }{\pi } +k_{s} C_{n} \cos ^{n} \alpha . \tag{16}\]
The first term characterizes the presence of a diffuse reflection component; then the second term characterizes the presence of a directional reflection component, \(k_{d}\) is the corresponding characterization is the diffuse reflection coefficient, \(k_{3}\) is the corresponding characterization is the directional reflection coefficient: clear \(k_{d} +k_{s} \le 1\), \(\alpha\) is the corresponding characterization is the angle between the specular reflection and its outgoing direction, \(n\) is the corresponding characterization is the specular index, the higher the value, the greater the occurrence of peak situations and \(C_{n}\) corresponds to the characterization of the normalization factor, \(C_{n} \le {\left(n+2\right)\mathord{\left/ {\vphantom {\left(n+2\right) 2\pi }} \right. } 2\pi }\).
This model is a luminance model constructed with reference to the actual obtained reflectance properties and does not have a specific physical characterization.
Ward’s model
This model supports the principle of conservation and interchangeability, and each parameter can be physically represented, and the parameter information can be obtained in the form of measurements: \[\label{GrindEQ__17_} f_{,} \left(\theta _{i} ,\phi _{i} ,\theta _{r} ,\phi _{r} \right)=\frac{\exp \left[-\frac{\tan ^{2} \alpha }{\sigma ^{2} } \right]}{4\cdot \pi \cdot \sigma ^{2} \cdot \sqrt{\cos \theta _{i} \cdot \cos \theta _{r} } }, \tag{17}\] where \(\sigma\) – characterizes the roughness of the surface where the object is located and \(\alpha\) is the angular difference between the normal vector of the characterized surface and its normal vector.
For the BRDF model with isotropic behavior, the Ward model is more simple and efficient, and to a certain extent, it can replace the Phong model, so that the computer can show more realistic results during the graphic control process.
In this paper, we choose photon mapping technology to implement the rendering engine on NVIDIAGPUs. Photon mapping is an extension of distributed ray tracing that can handle almost all optical phenomena, including highlights, glossy surfaces, surfaces diffusely reflecting off each other, refraction, and focal dispersion. Photon mapping exists independently of the scene geometry model and does not require the subdivision of surfaces as in radiosity methods, thus enabling the handling of large and complex scenes. Photon mapping algorithms are simple and relatively easy to implement using GPU parallelization.Different light sources emit photons in different directions, assuming that each photon carries a luminous flux of \(\rho _{photon}\), the luminous flux emitted by the light source per unit time \(\rho _{light}\) is obtained by calling the Light::Power function, which calculates the surface light intensity integral of the entire light domain network, for example, the luminous flux emitted per unit time of a point light source is to seek the spherical surface integral, so the number of photons emitted by each light source is easy to derive: \[\label{GrindEQ__18_} \rho _{light} =\int _{S^{2} }I d\omega =I\int _{S^{2} }d \omega =4\pi I\; \; n_{e} =\frac{\rho _{light} }{\rho _{phoon} } . \tag{18}\]
As can be seen from the framework diagram, the processing of direct illumination uses distributed ray tracing, where light is projected into the scene from the eye, and multiple secondary rays may be generated recursively at the same time; for non-highlighted surfaces shadow rays are projected to compute the direct illumination, and for high-lighted surfaces multiple specularly reflected and refracted rays are projected to compute the highlighting effect. At each first intersection occurrence, its indirect illumination must be calculated at the same time, the indirect illumination is calculated using photon mapping techniques to increase the speed of calculation, and to improve the image quality, a final collection link is added, where light is collected by projecting light in random directions from the sampling point using a Russian roulette wheel method, and the indirect illumination of the sampling point along each light ray incident on that sampling point is calculated based on the evaluation of the photon concentration of the global photon map, and finally, the Monte Carlo integral is used to calculate the indirect light incident on that sampling point.
In this study, the scenes were first screened through a screening experiment, and then the screened scenes were applied to the perceptual difference experiment. The perceptual difference experiment is mainly divided into two experiments, the first is the picture perception experiment, including four groups of material pictures. The second is the VR perception experiment, which mainly combines VR technology to realize scene perception and roaming. Eventually, the results of the experiment will be synthesized to explore the application of different VR technologies to the perception of green low-carbon design for rural residents in Hainan, so the idea of this study will be centered on the experiment. Scene screening questionnaire distribution.
Distribute 300 questionnaires through the network, the effective sample after screening test is 285, the questionnaire effective rate of 95%. Men and women were 132 and 153 respectively. 146 of them were professionals related to landscape architecture (51.23% professionals and 48.77% non-professionals). Most of the fillers were 19-26 years old, accounting for 93%, while 98.25% of the population had a bachelor’s degree or higher. It can be seen that the gender ratio of the survey population is more balanced, the proportion of professional and non-professional people is also more balanced, and from the viewpoint of the educational level of the fillers, the survey population is more educated.
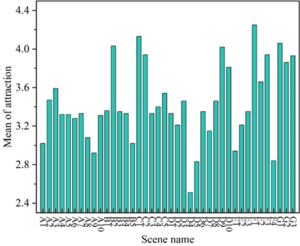
The reliability of the scene screening questionnaire was first examined and the results showed that the overall Cronbach’s \(\alpha\) value of the questionnaire was 0.9634, which is a very good overall reliability. The results of the mean value of attractiveness of each scene picture are shown in Figure 2 below. According to the results, among the 40 scene pictures, they were grouped according to the elements of towers (A1-A10), residential houses (B1-B5), street crossings (C1-C5), streets and alleys (D1-D10), transportation (E1-E3), markers (F1-F4), and underground water systems (G1-G3). The results of the experiment found that among the 10 photos of towers, the highest gravitational attraction is towers A3 (3.59) and the lowest is towers A9 (2.92). Residence B2 has the highest mean value of attraction and B5 has the lowest, with mean values of attraction of 4.03 and 3.02, respectively.Cross-street building C1 has the highest mean value of attraction (4.13) and C3 has the lowest (3.33). The highest mean values of attractiveness were found in D9 (4.02), E3 (3.35), F1 (4.25), and G1 (4.06) for streets, transportation, signage, and underground water systems, respectively. The lowest mean values of attractiveness were D4 (2.51), E1 (2.94), F4 (2.84) and G2 (3.86), respectively. The two scenes with the highest and lowest degree of perceived attractiveness of the population were selected from each element, and a total of 14 scene pictures were finally screened for subsequent perceptual difference questionnaire design.
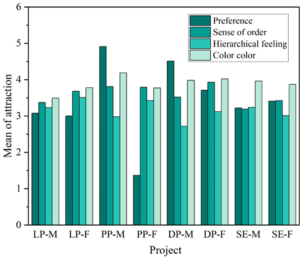
LP represents the real image group, PP represents the point cloud model image group, DP represents the UAV true 3D model image group, and “SE” represents the SU+Enscape model image group. Male (M), female (F). Figure 3 shows the difference in landscape perception between men and women in the picture group. The results of gender classification from landscape perception data showed that the scores of males were 3.08, 3.37, 3.23 and 3.49 in the four aspects of “preference, sense of order, sense of hierarchy and sense of color” in the real-life picture group, and the scores of females were 3, 3.68, 3.51 and 3.78, respectively. In the cloud model image group, the preference score of males (4.91) was higher than that of females (1.37). In the UAV group, the preference degree of men (4.51) was higher than that of women (3.71), and the sense of order, hierarchy and color were lower than those of women. In the SE group, there was little variation in the scores between the groups for men and women.
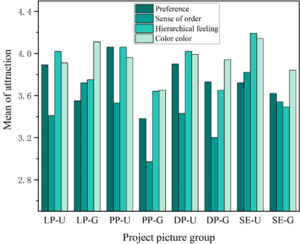
Undergraduate (U), graduate and above (G). The landscape perception data were categorized according to the education factor, and the differences in landscape perception between different education levels on the picture groups are shown in Figure 4. The experimental results show that in the preference and hierarchy found on the real picture group, undergraduates’ ratings (3.89, 4.02) are higher than those of the graduate students and above (3.55, 3.75); their order and color ratings, undergraduates’ ratings (3.41, 3.91) are lower than those of the graduate students and above (3.72, 4.11). In the point cloud, UAV, and SE groups, undergraduates’ scores were higher than those of graduate students and above.
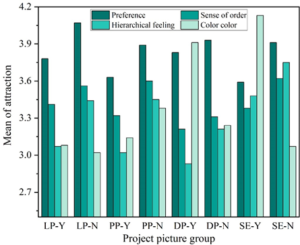
The landscape perception data were categorized according to the professional background factor, landscape related majors (Y), non-landscape related majors (N). The difference in landscape perception between the professional and non-professional populations on the picture group is shown in Figure 5 below. The experimental results can be seen that on the real-life picture group, the scores of preference (3.78), sense of order (3.63), sense of hierarchy (3.83), and sense of color (3.59) of the professional population are lower than those of the non-professional population (4.07, 3.89, 3.93, and 3.91). In the point cloud group, the preference, sense of order, sense of hierarchy, and sense of color scores (3.41, 3.32, 3.21, and 3.38) were also lower in the professional population than in the non-professional population (3.56, 3.6, 3.31, and 3.62). On the UAV group, it appeared that the preference, sense of order, sense of hierarchy, and sense of color (3.07, 3.02, 2.93, and 3.48) were all lower in the professional population than in the non-professional population (3.44, 3.45, 3.21, and 3.75). On the SE group, the professional population had a higher degree of preference (3.08), sense of hierarchy (3.91), and sense of color (4.13) than the non-professional population (3.02, 3.24, and 3.07), and the professional population had a lower sense of order (3.14) than the non-professional population (3.38).
Walking around in three-dimensional space, can realize multi-angle, multi-level view, as in the real site to watch the general, effectively improve the degree of user perception, so that users can more clearly understand the final decoration effect. In this paper, the Hainan countryside three rooms and two halls of residential design. The traditional program design can only show part of the design, and customers want to be able to see the house before the renovation of the panoramic view of all the space, including children’s rooms, studies, kitchens, bathrooms, checkrooms and other designs. The object of this paper is to design the interior space design of a representative two-room and two-bathroom 20-room residential house in a countryside of Hainan Province, which has a dining room, a living room, a kitchen, a bathroom, a living balcony, a viewing balcony, a master bedroom, a second bedroom, and so on. This paper uses VR technology for modeling and roaming design to bring customers into the overall spatial scene for a dead-angle-free viewing of the scene this design.
This paper compares the effects of seven existing residential design technologies in nine aspects: visual (V), auditory (H), tactile (T), existing space (ES), virtual space (VS), static (S), dynamic (D), real-time interaction (RTI) and green and low-carbon (GLC). Table 1 shows the comparison results between the VR technology display and the traditional indoor solution. The results of the survey show that the use of VR technology to experience the interior decoration space of the building can make users visual, auditory, and tactile changes. The scene space produced by VR is based on the real space, which can display both static and dynamic space. In all the indoor scheme displays, only VR technology can achieve scene interaction. In addition, the design process of VR technology does not consume materials such as paper materials to make sample rooms, and at the same time, it can also allow customers to feel the effect of the design and various details in an immersive way without being on site, truly realizing the green and low-carbon concept of the residential design process. It can be seen that the VR technology display reflects the characteristics of the traditional indoor scheme display, which is better than the display effect of other schemes.
| Scheme | V | H | T | ES | VS | S | D | RTI | GLC |
| Hand-drawn sketches | Yes | No | No | Yes | Yes | Yes | No | No | No |
| CAD | Yes | No | No | Yes | No | Yes | No | No | Yes |
| Model | Yes | No | No | Yes | Yes | Yes | No | No | |
| Rendering | Yes | No | No | Yes | Yes | Yes | No | No | Yes |
| Sample room | Yes | No | Yes | Yes | No | Yes | No | No | No |
| Animation | Yes | Yes | No | Yes | No | No | Yes | No | Yes |
| VR technology | Yes | Yes | Yes | Yes | Yes | Yes | Yes | Yes | Yes |
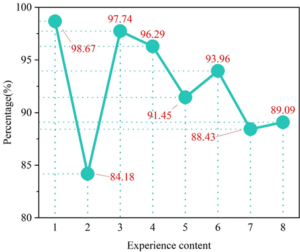
This paper randomly selects 100 local people in Hainan Province to experience and evaluate the VR design effect. Through the data collection, organization and comparative analysis of the satisfaction of the experience in eight aspects, namely, “three-dimensional effect (1), spatial continuity (2), immersive experience (3), realistic video and audio (4), switching of decorative elements (5), tactile action interaction (6), freshness (7), operability (8)”, the results of the average satisfaction of the public with the experience of VR design effect are shown in Figure 6. The average satisfaction test results of VR design effects are shown in Figure 6. The results show that the public’s average satisfaction with VR technology for designing residential houses is above 80%. In terms of 3D effect design, VR technology is the most popular among the public, and its average satisfaction is the highest at 98.67%. Public satisfaction with the spatial continuity aspect of VR design was the lowest compared to the other 7 aspects, with an average satisfaction of 84.18%. And the public’s average satisfaction with the remaining 6 aspects, in descending order, is immersive experience (97.74%) \(\mathrm{>}\) realistic video and audio (96.29%) \(\mathrm{>}\) touchable motion interaction (93.96%) \(\mathrm{>}\) switching of decoration elements (91.45%) \(\mathrm{>}\) operability (89.09%) \(\mathrm{>}\) freshness (88.43%). Therefore, it can be seen through the survey and analysis that VR technology greatly meets the needs of users, improves the participation of users who are in the realm without going out of the house, and in the design from the characteristics of the Hainan countryside residence, so that the design process is green and low-carbon, at the same time, it is well adapted to the public’s feelings about the experience of the residence, which is enough to reflect the advantages of VR technology in the green and low-carbon design of the residence.
This paper firstly gives an overview of the VR technology in the indoor visualization design system of residential houses, and then analyzes the application effect of VR technology in the landscape perception and design of Hainan residential houses, and concludes that the superiority of VR technology applied in the design of indoor decoration scheme provides a reference and reference for the green and low-carbon indoor scheme design of Hainan rural residential houses. The main conclusions are as follows:
Men’s ratings on the four aspects of preference, sense of order, sense of hierarchy, and sense of color in the live image group are 3.08, 3.37, 3.23, and 3.49, respectively; women’s ratings are 3, 3.68, 3.51, and 3.78, respectively. undergraduates’ ratings of the indicators in the point cloud group, the drone group, and the SE group were higher than that of the graduate students and the above groups. In addition, the ratings of the professional population in all four aspects of the live picture group (3.78, 3.63, 3.83, and 3.59) were lower than those of the non-professional population (4.07, 3.89, 3.93, and 3.91).
The use of VR technology allows users to produce visual, auditory, and tactile changes in the spatial experience of the decoration scheme in the interior of the building.The scene space produced by VR can display both static and dynamic space.VR technology can do the interaction of the scene in the display of the indoor scheme, and the display effect of the scheme is better than the other schemes.
The public’s average satisfaction with the eight aspects of VR technology for designing residential houses is greater than 80%; in addition, the residents’ satisfaction with the eight features, in descending order, are three-dimensional effect (98.67%), immersive experience (97.74%), realistic video and audio (96.29%), touchable action interaction (93.96%), switching of decoration elements (91.45%) , operability (89.09%), freshness (88.43%) and spatial continuity (84.18%).
This research was supported by the 2023 Hainan Province Philosophy and Social Science Planning Project: “Research on Green and Low Carbon Design of Rural Residential Buildings in Hainan Province (project number: HNSK (QN) 23-94)”. Project supported by the Education Department of Hainan Province: Research on Regional Function Optimization of Landscape Architecture in Hainan under the Background of Rural Revitalization (project number: Hnkyzc2022-16). Project supported by Haikou University of Economics: “Design and research of Hainan characteristic homestays from the perspective of rural tourism (project number: HJKY (JD) 23-12)”.