
China’s residential real estate relative to foreign developed countries started late, mainly experienced three stages. The first stage is before 1978, is the state-led planning mode stage, the second stage is from 1978 to coincidentally 98 years of commercialization of the development of the pilot stage, the third stage is from 1998 to the present financial development stage[1-3]. 1978 China’s real estate did not form an independent industry, mainly because of the then in the highly centralized juice economic system, and 1978, China implemented the “reform and opening up” national development strategy, under the catalyst of the “market”, China’s real estate has become an independent industry, mainly because of the then in highly centralized juice economy, and in 1978, China implemented the “reform and opening up” national development strategy. In 1978, China implemented the national development strategy of “reform and opening up”, and under the catalyst of “market”, China’s real estate industry was rapidly formed and developed, and the period from 1998 to 2003 was a period of accumulation of power for China’s real estate development, in which the government canceled the policy of welfare housing, and solved the housing problem through the market and personal credit. The government abolished the policy of welfare housing, and solved the problem of insufficient consumption capacity of housing and housing through the market and personal credit. During this period, the real estate market transitioned from a planned economy to a market economy, and established a market transaction structure dominated by independent demand. But at the same time, the real estate market formed a situation of explosive growth and poor derivation structure of the industry. Since 2013, the government has established the development idea of “urbanization”, trying to change the previous “land” as the core of the real estate development model into a “land” as the core of the real estate development model. The government has established the development idea of “urbanization” since 2013, trying to change the previous real estate development model that takes “land” as the core to the development model that takes “people” as the core[4-6]. Under the guidance of the new development model, the central government will carry out a series of changes to promote the healthy development of the real estate market[7,8]. This series of real estate development trend will lead the real estate towards a healthier direction, so that the real estate from investment-led to consumption-led change, from short-term investment to medium- and long-term investment change, from the land for the middle also to the product for the middle, change, from the increase in the market to the incremental, stock and concurrent development change, from the phenomenon of general up and down to the phenomenon of rise and fall, from the generalized market to the segmentation of the market change[9-12].
As the real estate market changes from a seller’s market to a buyer’s market and the market competition becomes more and more intense, more and more real estate companies realize that they must establish a sustainable competitive advantage from the perspective of consumers[13,14]. For consumers, housing is no longer just a place to live, but also represents a healthy lifestyle, a harmonious neighborhood and a civilized community space. Consumer demand for housing is not only limited to the wind, rain, sleep and rest, community planning and design, housing location, structure and function of the higher requirements, at the same time more calm, less blind, accumulated considerable knowledge and experience, consumer psychology gradually mature, the value of real estate value demand has also undergone great changes. As an enterprise, it is necessary to recognize the consumers, communicate with them effectively, and develop products that are suitable for the needs of the consumers in order to effectively stand firm in the market[15-18]. In order to win the consumers, the enterprise can only study the trend of consumer psychology and behavior, according to the capacity of the customer market, the customer group. The composition of the customer base is very complex structure, needs and tastes are not the same, must be targeted planning. Find out the key factors affecting different classes, strengthen the development of psychological attributes of products, improve the psychological cost-effectiveness of consumers, through reasonable product quality, pricing and service to meet the needs and desires of consumers’ material and spiritual life[19-21].
Real estate marketing is a hotspot that academics and the market are currently focusing on, and previous research has mainly started from the real estate project or the corporate brand itself. The emergence of brand community value theory provides a new perspective for real estate enterprise marketing. The innovation of this paper lies in the introduction of the concept of repeat purchase behavior as the final variable of the real estate brand community mechanism, and the introduction of customer fit as the mediating variable of the mechanism. Combining theory and practice, this paper adopts structural equation modeling to construct a conceptual model of repeat purchase behavior in the residential market driven by digital marketing technology, and verifies whether the value of real estate brand community can influence repeat purchase behavior, which opens up new research perspectives.
The conceptual definition of real estate brand community value is divided into two narrow and broad definitions[22]. The narrow view of brand community value is based on the idea that a brand community is a set of community relationships centered on a particular brand, which is based on the structural social relationships of people who use the same brand products, and consists of special, non-blood, and non-territorial ties. A brand community is connected by the emotional interest consumers have in the brand. The broader brand community value considers brand community as a network of relationships between consumers and products, other consumers and marketers. If the brand community is viewed only as a collection of social relationships of brand users and their relationships with the brand itself, certain relationships in the brand community may be overlooked. Relying on the Internet platform, brand community breaks through the limitations of geography and time, broadens the way of community maintenance and the volume of information exchange, and realizes highly efficient communication within and outside the community.
Through the above narrow and broad concept definitions, the value of the real estate brand community can be divided into five dimensions: financial value, social value, information value, image value and entertainment value.
Information value: The value of various brand information (A1), property service information (A2), living experience information (A3) and convenience (A4) that can be obtained efficiently and conveniently through the community.
Financial Value: Values such as economic benefits (B2), points benefits (B2) and preferential purchase rights (B3) obtained by virtue of community membership or through participation in community activities.
Social value: The value of establishing good relationships with other members through daily community communication (C1), building community interpersonal networks (C2), exchanging and sharing information (C3) and social life (C4).
Entertainment value: The enjoyment (D1), experience value (D2) and positive emotional value (D3) brought to community members through various community entertainment activities.
Image value: Through the identity of community members, others recognize (E1) and respect (E2), to enhance the personal identity image (E3) and social status (E4) and other values.
Customer fit is the manifestation of a customer’s behavior towards a brand or company, not just the act of purchasing; customer fit is driven by motivations such as word-of-mouth activity, referrals, helping other customers, writing reviews, and so on. Customer fit is also about customers becoming interested in and attached to a brand, and then investing that enthusiasm in subsequent co-creation or repeat purchases. In addition to brand, customer fit can be associated with a variety of customer experiences (e.g., self-service, shopping), channels (e.g., physical, virtual), and marketing environments (e.g., advertising, campaigns). Customer fit antecedent influences include the following:
Insights into how real estate brands create customer fit and foster loyal customers (F1) through the lens of commitment, engagement, and trust.
The relationship between a real estate brand’s interactions with internal and external customers and customer fit (F2).
Strong attachment to the real estate brand community (F3).
Seeing oneself as a member of that real estate brand community with a strong sense of identification (F4).
There is customer interaction between the user and the real estate brand, with a certain emotional connection (F5).
Repeated purchasing behavior, which expresses the expectations and tendencies of customers to maintain the relationship with the current supplier, i.e., the intention of the customer to purchase the same goods again before the next purchase, in accordance with the real feelings of this application, after the acquisition of products and services and after their application[23]. At the theoretical level, it comes under the scope of customer loyalty. Repeat purchase intention and repurchase behavior is the link between willingness and behavior, the former is the customer’s psychological behavior, has a significant non-determinism, from the former to predict the latter, although with the purchase intention will not be 100% of the final purchase behavior, but the purchase intention is still a key indicator of the customer repurchase behavior to make predictions.
The factors that influence customer repurchase behavior are divided into two major levels, one is the individual customer and the other is the brand. The elements in these two dimensions are classified into five main types, namely, customer perceived value (G1), customer satisfaction (G2), switching cost (G3), and consumption time spacing (G4), and user repurchase intention (G5), which are considered to be the main influences that interfere with the repurchase behavior of customers.
Structural equation modeling (SEM) method, which integrates the two statistical ideas of factor analysis and path analysis, is essentially a validated model analysis method[24]. SEM is a statistical technique for measurement research that integrates measurement and analysis, which is a major advantage over traditional methods. SEM can not only estimate the measurement errors of the observable variables, but also assess the reliability and validity of the measurements. At the same time, it can deal with and analyze the complex relationship between observable variables and each other, between observable variables and latent variables, and between latent variables and latent variables directly or indirectly.
Covariance is a central concept in SEM analysis and is defined as: \[\label{GrindEQ__1_} COV(X,X)=\frac{\sum (X-\overline{X})(Y-\overline{Y}) }{N} ,\tag{1}\] where $\overline{X}$ and $\overline{Y}$ are the overall means of the two variables X and Y respectively, SEM utilizes the covariance matrix between variables to describe the degree of correlation between multiple variables, and verifies the model fitness through the difference between the covariance of the theoretical hypothesized model and the covariance of the actual sample data. The so-called covariance can be simply understood as the linear correlation between two variables, which is positive when there is a positive linear correlation between the variables and negative when there is a negative linear correlation between the variables.
In SEM, the covariance matrix refers to the covariance matrix of the sample data. The diagonal of the covariance matrix is the variance (the covariance between the variables themselves), and the covariance outside the diagonal is the covariance. The covariance matrix of the sample data for two variables X and Y is: \[ S{\rm =}\left[\begin{array}{cc} {COV(X,X)} & {COV(Y,X)} \\ {COV(X,Y)} & {COV(Y,Y)} \end{array}\right] .\tag{2}\]
SEM analyses with small sample sizes will lack stability in their estimates.
SEM is divided into two basic models: structural model and measurement model.
Structural model: Structural model describes the path relationship between latent variables, which can be categorized into exogenous latent variables and endogenous latent variables, with exogenous latent variables being the cause, denoted by the symbol ξ, and endogenous latent variables being the effect, denoted by the symbol η. If there is only a structural model without a measurement model, the analysis of SEM is equivalent to the traditional path analysis, which discusses the linear relationship between latent variables, and its structural equation is similar to the regression equation of multiple regression. Figure 1 illustrates a structural model consisting of 2 exogenous latent variables and a single endogenous latent variable.
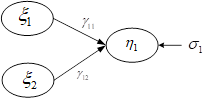
where σ is the residual term in the structural model, indicating the part of the endogenous latent variable that is difficult to be explained by the exogenous latent variable and other endogenous latent variables, the regression equation of the above model is expressed as: \[\begin{equation} \label{GrindEQ__3_} \eta _{1} =\gamma _{11} \xi _{1} +\gamma _{12} \xi _{2} +\sigma _{1}. \end{equation}\tag{3}\]
Measurement model: The measurement model consists of observable variables of latent variables. Observable variables are explicit measurements of latent variables, which can generally be obtained from questionnaires, scales and other research tools. Potential variables are concepts abstracted from observable variables, for example, in social behavior research often set up certain hypothetical concepts that can not be directly measured or observed, such as anxiety, motivation, satisfaction, etc., and the variables associated with such concepts need to be reflected by the sample data of the observable variables, and in general the potential variables must be estimated by more than two observable variables. Figure 2 illustrates the measurement model with three observable variables.
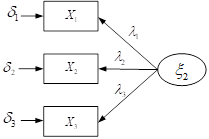
where λ is the factor loading of the observable variable and δ is the measurement error of the observable variable, the regression equation for the above measurement model is given in Eq: \[\label{GrindEQ__4_} \left\{\begin{array}{l} {X_{1} =\lambda _{1} \xi _{1} +\delta _{1} } \\ {X_{2} =\lambda _{2} \xi _{1} +\delta _{2} } \\ {X_{3} =\lambda _{3} \xi _{1} +\delta _{3} } \end{array}\right. .\tag{4}\]
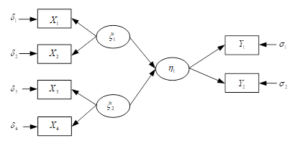
Generally speaking, SEM includes several measurement models and a structural model, in which the correlation between external latent variables can be set according to theory and actual situation, but the relationship between external latent variables and intrinsic latent variables must be “cause” and “effect” (ξ points to δ), Figure 3 shows a structural equation model composed of 3 measurement models and 1 structural model.
The purpose of model definition is mainly to clarify the connection between the theoretical architecture and the real world, i.e., how latent variables are reflected through explicit or observable variables. Typically, observable variables can be categorized into formative and reflective variables. Reflective variables refer to latent variables that act as causes of observable variables, and observable variables are effect variables that reflect their corresponding latent variables. Formative variables are linear combinations of observable variables as causes and latent variables as observable indicators. The regression equations for formative and reflective indicators are different. Assuming that there is a measurement model consisting of a latent variable η and two observable variables X1 and X2, the regression equation when the observable variable is a formative variable is as follows: \[\begin{equation} \label{GrindEQ__5_} \eta _{1} =\gamma _{1} X_{1} +\gamma _{1} X_{2} +\delta . \end{equation}\tag{5}\]
The regression equation when the observable variables are reflective is as follows: \[\label{GrindEQ__6_} \left\{\begin{array}{l} {X_{1} =\beta _{1} \eta +\varepsilon _{1} } \\ {X_{2} =\beta _{2} \eta +\varepsilon _{2} } \end{array}\right. .\tag{6}\]
Parameter estimation in software programs is more difficult when formative variables are present in the SEM, so observable variables are generally set as reflective of latent variables in the modeling assumptions of the LISREL and AMOS software.
There are a total of seven latent variables in the structural model in this study, and therefore seven measurement models exist. Among them, information value, financial value, social value, entertainment value and image value in brand community value, 5 exogenous latent variables in the measurement model 18 driving factors are composed. And customer fit and repeat purchase behavior variables, respectively, consist of 5 driving factors. This study used AMOS software for SEM analysis.Since AMOS uses ML parameter estimation method by default, it is important to ensure the normality of the sample before the formal SEM analysis.Normalization transformation is performed on the data that do not satisfy the conditions.Box-Cox transformation can significantly improve the normality of the data with the following formula: \[\label{GrindEQ__7_} \left\{\begin{array}{l} {W_{i} =Y_{i}^{\lambda } ,if) ) \lambda \ne 0) ) ) } \\ {W_{i} =\ln (Y_{i} ),if) ) \lambda =0) ) } \end{array}\right. ,\tag{7}\] where Yi is the initial data value, \(\lambda\) is the parameter value for the conversion, and \(\lambda\) is generally between -5 and 5.
Determination of latent variables is the basis for the establishment of the SEM model, and the repeated purchase behavior of customers of commercial properties has its own mutually causal variables, which are unobservable latent variables that are directly or indirectly affected by multiple factors. This paper searches for the interrelationships between the variables from the existing data and research, uses data to prove the theoretical relationship, and describes the formation of the mechanism of customer repetitive purchasing behavior.
In the study of repeat purchase behavior of customers of commercial properties, there exists a certain degree of direct or indirect relationship between these latent variables. Therefore, it is necessary to put customer satisfaction into a comprehensive system to consider, estimate the relationship between customer repeat purchase and its indicators, and also study the interrelationship of each latent variable. Based on this this paper proposes a conceptual model of customer fit in repeat purchase behavior in the residential market driven by digital marketing technology as shown in Figure 4. Path analysis is mainly used to verify whether there is a causal relationship between the variables in the model, and this paper uses AMOS to analyze the path diagram of the dependent variable path model obtained.
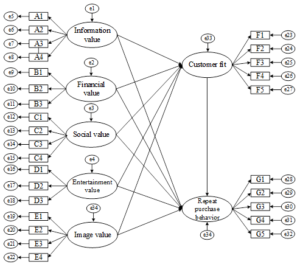
Descriptive Statistical Analysis of the Questionnaire The questionnaire for this study was developed using a 5-point Likert scale, and the questionnaire for this study consisted of 3 parts. The first part is the measurement of real estate brand community value asking items, including information value (A1 A4), financial value (B1 B3), social value (C1 C4), entertainment value (D1 D3) and image value (E1 E4), totaling 5 dimensions and 18 question items. The second part is the measurement of residential brand customer fit, totaling 5 question items (F1 F5). The second part is the measurement of repeat purchase behavior, totaling 5 question items (G1 G5). Since the measurement object of this study is a household-based group, the questionnaire was distributed to households and only one questionnaire was filled out for each household. This study utilizes the WeChat platform, the number of questionnaires issued is 384, excluding the group that does not own a set of commercial housing and the group that the questionnaire filling time is less than 180 seconds (the reason for exclusion is that the filling time is too short, there is the suspicion of perfunctory filling), a total of 294 valid questionnaires were recovered, the valid questionnaire accounted for 76.56%.
The results of the mean and standard deviation of the internal question items of each variable are shown in Figure 5. From the results of the mean and variance of each variable, it can be seen that the mean of the internal question items of each variable is greater than 3 and less than 4, and the standard deviation is distributed between 0.5 and 1.5, which indicates that the recovered samples have a better distribution, and it can be applied to further analysis.

In this study, the stability of the questionnaire and the consistency of the data were examined through reliability analysis. In social studies, the reliability of the questionnaire is considered to be qualified when the value of Cronbach’s alpha coefficient is greater than 0.7. The results of this study measured by SPSS 22.0 software are shown in Table 1. It can be concluded that the Cronbach’s alpha coefficients of information value, financial value, social value, entertainment value, image value, customer fit, and repeat purchase behavior are 0.780, 0.814, 0.852, 0.834, 0.780, 0.845, and 0.804, respectively, and the Cronbach’s alpha coefficient of the total scale is 0.838, which were all greater than 0.7. The Cronbach’s alpha reliability coefficients after deletion were all lower or not significantly higher than the original coefficients, suggesting that no deletion was necessary for all the question items and that all the scale measurement topics designed in this paper demonstrated excellent intrinsic uniformity.
| Variable | Cronbach’s alpha coefficient |
After deleting the Cronbach’s
alpha coefficient |
Item number | |
|
The value of the real
estate brand community |
Information value | 0.780 | 0.760 | 4 |
| Financial value | 0.814 | 0.817 | 3 | |
| Social value | 0.852 | 0.823 | 4 | |
| Entertainment value | 0.834 | 0.803 | 3 | |
| Image value | 0.780 | 0.754 | 4 | |
| Total | 0.804 | 0.776 | 18 | |
| Customer fit | 0.845 | 0.817 | 5 | |
| Repeat purchase behavior | 0.804 | 0.801 | 5 | |
| Total | 0.838 | 0.817 | 28 | |
Content validity: This study examines the comprehensiveness and accuracy of the questionnaire items through content validity. The question items in the questionnaire of this study are derived from previous related studies, so the credibility of the question items is high. However, most of the quoted scales are foreign scales, which may have the problem of ambiguity in presentation; therefore, this study did a pre-survey before formal distribution, organized the information recovered, and modified the statements of each individual question item so that the questionnaire would not cause ambiguity or mislead the respondents. Therefore, there is no problem with the content validity of the questionnaire in this study.
Structural validity: In this study, the structural validity of the questionnaire was examined through factor analysis, and the results of the validity test of each variable are shown in Table 2. It can be seen that the KMO coefficients of information value, financial value, social value, entertainment value, image value, customer fit, and repeat purchase behavior are 0.7832, 0.8445, 0.8514, 0.8523, 0.8523, 0.8723, 0.8967, and 0.9425, respectively, which are greater than 0.6, indicating that the results of the structural validity test are good. The results of the analysis explained more than 80% of the original variables, indicating that the question items of this questionnaire explained the variables of this study to a good extent, and the validity of the application in the study of repetitive purchasing behavior in the residential market is good enough for further analysis.
| Variable | Item | Common factor | KMO | Cumulative contribution | |
| The value of the real estate brand community | Information value | A1 | 0.6774 | 0.7832 | 80.780% |
| A2 | 0.7935 | ||||
| A3 | 0.8066 | ||||
| A4 | 0.8160 | ||||
| Financial value | B1 | 0.7816 | 0.8445 | 86.722% | |
| B2 | 0.8017 | ||||
| B3 | 0.8226 | ||||
| Social value | C1 | 0.8610 | 0.8514 | 84.386% | |
| C2 | 0.8859 | ||||
| C3 | 0.9065 | ||||
| C4 | 0.9154 | ||||
| Entertainment value | D1 | 0.7258 | 0.8523 | 86.880% | |
| D2 | 0.7563 | ||||
| D3 | 0.8168 | ||||
| Image value | E1 | 0.7528 | 0.8723 | 88.433% | |
| E2 | 0.7704 | ||||
| E3 | 0.7893 | ||||
| E4 | 0.8701 | ||||
| Customer fit | F1 | 0.7585 | 0.8967 | 85.634% | |
| F2 | 0.7647 | ||||
| F3 | 0.8149 | ||||
| F4 | 0.8358 | ||||
| F5 | 0.8507 | ||||
| Repeat purchase behavior | G1 | 0.7445 | 0.9425 | 89.782% | |
| G2 | 0.7978 | ||||
| G3 | 0.8520 | ||||
| G4 | 0.9279 | ||||
| G5 | 0.9325 | ||||
The questionnaire data of this study has been tested to have good reliability and validity, and now the structural equation modeling is completed using AMOS 23.0 software to explore the relationship between residential brand community value, customer fit and repeat purchase intention and test the research hypotheses. After importing the questionnaire data, the structural equation model is constructed and fitted with residential brand community value as the independent variable, customer fit as the mediator variable, and repeat purchase behavior as the dependent variable. Each fitting index is shown in Table 3, where CMIN is the approximate chi-square, DF is the degrees of freedom, CMIN/DF is the chi-square degrees of freedom ratio, GFI is the goodness-of-fit index, AGFI is the adjusted goodness-of-fit index, and RMSEA is the approximate root mean square error. IFI is the incremental fit index, NFI is the canonical fit index, TLI(NNFI) denotes the non-canonical fit index, CFI is the comparative fit index, and SRMR is the standardized root mean square residual. It can be seen that the chi-square degrees of freedom ratio (CMIN/DF) is 1.312 < 3, and the AGFI is 0.882 close to 0.9, and almost all the fit indices are within the acceptable range, which indicates that the model of this study possesses a good degree of fit.
| Fitting index | Acceptable range | Measured value |
| CMIN | — | 442.312 |
| DF | — | 337 |
| CMIN/DF | 3 | 1.312 |
| GFI | 0.9 | 0.907 |
| AGFI | 0.9 | 0.882 |
| RMSEA | 0.08 | 0.042 |
| IFI | 0.9 | 0.981 |
| NFI | 0.9 | 0.921 |
| TLI(NNFI) | 0.9 | 0.982 |
| CFI | 0.9 | 0.958 |
| SRMR | 0.05 | 0.049 |
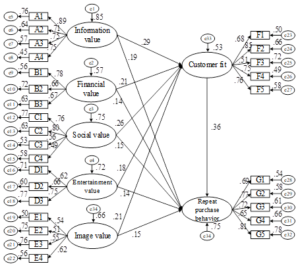
The model diagram of the influence mechanism of residential brand community value on repeat purchase intention is shown in Figure 6. It can be intuitively seen that the standardized coefficients ( ) of information value (INF), financial value (FIN), social value (SOC), entertainment value (ENT), and image value (IMA) of residential brand community value on users’ repeat purchase behavior (RPB) are 0.19, 0.14, 0.15, 0.14, and 0.15, respectively.The standardized coefficient ( ) of mediator variable (customer fit CUF) on user repeat purchase intention has a standardized coefficient of 0.36.
For the path coefficient results output after the model run are shown in Table 4. Where Estimate is the estimated parameter values, S.E. is the standard error, C.R. is the critical value, is the standardized coefficient, is the decidable coefficient, and is the significance. It can be seen that all five value dimensions in the community value of residential brands in this study have significant path coefficients of customer fit (p < 0.01), and the model explains 55.7% of the percentage of customer fit. The path coefficients of the five dimensions of residential brand community value in the study are significant (p < 0.05) with repeat purchase behavior, and the path coefficient of the mediating variable (customer fit) with repeat purchase behavior is significant (p < 0.001, = 0.36), and the model explains 65.2% of the percentage of repeat purchase behavior.
| Path | Estimate | S.E. | C.R. | \(P\) | \(\beta \) | \(R^2 \) |
| CUF\(\Leftarrow \)INF | 0.247 | 0.051 | 4.733 | *** | 0.29 | 0.557 |
| CUF\(\Leftarrow \)FIN | 0.233 | 0.07 | 3.911 | *** | 0.21 | |
| CUF\(\Leftarrow \)SOC | 0.248 | 0.052 | 4.384 | *** | 0.26 | |
| CUF\(\Leftarrow \)ENT | 0.167 | 0.046 | 2.965 | 0.006 | 0.18 | |
| CUF\(\Leftarrow \)IMA | 0.183 | 0.051 | 3.443 | *** | 0.21 | |
| RPB\(\Leftarrow \)INF | 0.131 | 0.042 | 3.228 | 0.003 | 0.19 | 0.652 |
| RPB\(\Leftarrow \)FIN | 0.108 | 0.048 | 2.356 | 0.04 | 0.14 | |
| RPB\(\Leftarrow \)SOC | 0.127 | 0.045 | 3.073 | 0.002 | 0.15 | |
| RPB\(\Leftarrow \)ENT | 0.121 | 0.043 | 3.042 | 0.003 | 0.14 | |
| RPB\(\Leftarrow \)IMA | 0.122 | 0.041 | 3.006 | 0.007 | 0.15 | |
| RPB\(\Leftarrow \)CUF | 0.277 | 0.052 | 4.657 | *** | 0.36 |
In this study, in order to test whether customer fit (CUF) is a mediating variable and to what extent it plays a mediating role, Bootstrap sampling method is used to construct confidence intervals to verify it, and 1000 samples are executed. If the confidence interval does not contain a value of 0 under bias correction of 95%, the path is valid.The results of Bootstrap mediation effect test are shown in Table 5. It can be seen that the mediation path of customer fit between the value of information and repeat purchase behavior indirect effect is 0.083, the lower limit of the confidence interval (LLCL) is 0.051 > 0, the upper limit of the confidence interval (ULCL) is 0.294, which is significant at the level of 0.001, the mediation is established. The direct effect was 0.181, with the lower and upper confidence interval limits (ULCL) of 0.072 and 0.294 > 0, respectively, significant at the 0.01 level, and the direct effect was established, further suggesting that the mediation was a partial mediation effect. Similarly, customer fit in the other paths, all of which play a partially mediated effect.
| Path | Effect size | Estimate | S.E. | Bias Corrected (95%) | Result | ||
| LLCL | ULCL | p | |||||
| INF \(\Rightarrow \) CUF\(\Rightarrow \) RPB | Direct effect | 0.181 | 0.041 | 0.072 | 0.294 | 0.000 | Partial mediation |
| Indirect effect | 0.083 | 0.032 | 0.051 | 0.138 | 0.000 | ||
| Total effect | 0.264 | 0.054 | 0.165 | 0.372 | 0.000 | ||
| FIN \(\Rightarrow \) CUF\(\Rightarrow \) RPB | Direct effect | 0.138 | 0.056 | 0.034 | 0.241 | 0.013 | Partial mediation |
| Indirect effect | 0.105 | 0.026 | 0.032 | 0.165 | 0.000 | ||
| Total effect | 0.243 | 0.055 | 0.099 | 0.316 | 0.000 | ||
| SOC\(\Rightarrow \) CUF\(\Rightarrow \) RPB | Direct effect | 0.141 | 0.054 | 0.055 | 0.283 | 0.001 | Partial mediation |
| Indirect effect | 0.076 | 0.033 | 0.046 | 0.163 | 0.000 | ||
| Total effect | 0.217 | 0.049 | 0.151 | 0.355 | 0.000 | ||
| ENT\(\Rightarrow \) CUF\(\Rightarrow \) RPB | Direct effect | 0.169 | 0.051 | 0.056 | 0.264 | 0.003 | Partial mediation |
| Indirect effect | 0.074 | 0.035 | 0.022 | 0.144 | 0.004 | ||
| Total effect | 0.243 | 0.057 | 0.115 | 0.335 | 0.001 | ||
| IMA\(\Rightarrow \) CUF\(\Rightarrow \) RPB | Direct effect | 0.169 | 0.023 | 0.054 | 0.226 | 0.000 | Partial mediation |
| Indirect effect | 0.070 | 0.024 | 0.031 | 0.118 | 0.001 | ||
| Total effect | 0.239 | 0.061 | 0.138 | 0.348 | 0.002 | ||
After actual market research and reference to previous studies, five dimensions of real estate brand community value are extracted, which are information, financial, social, entertainment, and image value. Meanwhile, repeat purchase behavior is selected as an operational indicator to measure repeat purchase. A questionnaire survey was conducted on members of mature real estate brand communities in several first- and second-tier cities across the country, 294 sample questionnaires were collected, and a structural equation model was constructed for fitting test to draw the following conclusions:
The standardized coefficients of information value, financial value, social value, entertainment value and image value of residential brand community value on customers’ repeat purchase behavior are 0.19, 0.14, 0.15, 0.14 and 0.15, respectively. The standardized coefficient of the mediating variable (customer fit) on the users’ repeat purchase intention is 0.36, and all of them show significant positive influence.
Customer fit can significantly increase the willingness of community members to repeat purchase behavior, and community members have a strong recognition and sense of belonging to the real estate brand community due to their self-identity perception and emotional factors, forming the willingness to repeat purchase.
Customer fit is facilitated by the value of the real estate brand community to enhance the influence of community members’ repeat purchase behavior. Between the three conceptual relationships, customer fit plays a partly intermediary role, customer fit can help stimulate community vitality, enhance community cohesion, the formation of community unique cultural values, the formation of repeat purchase behavior and consolidation of enhancement play a certain role in promoting. In conclusion, this paper provides a theoretical basis and practical application reference for the application of customer repeat purchase behavior in real estate marketing, and it has a certain guiding significance for real estate development enterprises to improve the repurchase intention of customers of their products and services from the perspective of digital marketing to win the long-term competitive advantage in the increasingly fierce market competition.
School-level project of Shenzhen Institute of Technology, “Research on the Influence Mechanism of Artificial Intelligence Marketing on Customer Repeat Purchase Behavior: An Analysis of the Mediating Path of Customer Brand Engagement” (Project No.: 2411003).
Doctoral Research Start-up Fund Project of Shenzhen Technician College, “An exploration of customer experience and customer brand engagement mechanism of AI products from the perspective of experience economy” (Project No.: 2314009).
Shenzhen Longgang District Intelligent Supply Chain Technology Research and Development Laboratory.
Achievements of Key Research Base of Humanities and Social Sciences in Shenzhen: Skilled Society Research Center of Shenzhen Institute of Technology.