
Indoor environmental comfort describes the degree of coziness felt by a person under a certain mental state in the indoor environment in which he or she lives, and is a relatively subjective concept that is closely related to information about an individual’s physical condition, psychological state, subjective feelings, and indoor environmental physical index parameters [1-3]. With the continuous progress of computer technology, electronic technology and Internet of Things technology and other scientific and technological techniques, more and more excellent theories, techniques, and related hardware equipment and tools are presented, which make real-time monitoring of the indoor environment possible [4-6].
Living and working in a safe, comfortable, and healthy indoor environment is one of the core requirements for a healthy and productive human life. How to objectively evaluate the comfort of the environment has been an important issue for many years [7,8]. The quality of indoor environment directly affects people’s quality of life and work efficiency, and even concerns the survival of human beings. The assessment of indoor environmental comfort is a process of comprehensive consideration of many factors [9,10]. By evaluating the indicators of temperature, humidity, light, noise, air quality and spatial layout, it can help designers to create more comfortable and satisfactory indoor spaces [11-13]. Through the combination of relevant tools and users’ subjective feelings and feedbacks, the comfort of indoor spaces can be assessed more comprehensively, and provide targeted improvement directions for interior design [14,15].
Literature [16] proposed an integrated adaptive system to improve indoor environmental conditions. The natural lighting levels at different periods and times were analyzed, and the results showed that the system achieves the improvement of indoor environmental conditions by minimizing glare. Literature [17] presented sustainability guidelines for assessing indoor light environments and analyzed the indoor environment using questionnaires, environmental analysis, and halo identification, emphasizing the importance of indoor light environments. Literature [18]assessed the comfort level of indoor environments in hospitals. A year-long environmental test was conducted and it was concluded that the environmental comfort varied greatly from one hospital interior to another and that the comfort of each interior was affected by the time of operation of the hospital. Literature [19] demonstrated an intelligent model prediction system for regulating indoor environmental quality and proper optimization of building energy management through ant colony algorithm, and the experimental results proved the usefulness of the system and effectively improved the indoor environmental quality. Literature [20] constructed a model for assessing indoor environmental quality, which can accurately assess the standard of each type of residence in terms of air quality, comfort, and lighting, and successfully applied it to practical assessment. Literature [21] clarifies that thermal comfort and indoor air quality, which improve indoor conditions, are essential elements of modern architecture. A questionnaire survey of students at a polytechnic university revealed that students preferred to work in cooler indoor environments. Literature [22] points out that comfort in indoor environments is influenced by factors such as visual comfort and respiratory comfort, and the lack of analyzed data is a shortcoming of previous research results. Through the survey, it was concluded that sensor technology has been widely used to collect data on various comfort levels.
The article proposes an indoor environment comfort assessment scheme based on three dimensions: thermal environment, light environment and air environment, and investigates the relevant factors affecting indoor environment comfort under multisensory design from different perspectives.
Oriented by multisensory design and multisensory comfort, this paper proposes to assess the thermal comfort of indoor environment by using the PMV model of thermal environment comfort, and to analyze the visual comfort and lighting illuminance changes in indoor light environment by Weber-Fechler, lighting coefficient and illuminance uniformity. From the indoor wind speed variation, ADPI, effective temperature difference and blowing sense are introduced to explore the comfort situation of indoor air environment. Based on the actual measurement data, the all-round analysis of indoor environmental comfort under multi-sensory design is carried out. Based on the analysis results, the planning and architectural design method of indoor environmental comfort design is proposed, and the related measures of indoor environmental comfort optimization are suggested.
Utilizing the characteristics of multi-sensory design to create a new way of thinking, fully releasing the use of indoor space, so that people and the indoor environment to get better communication and interaction. Due to the continuous development of society and the continuous progress of science and technology, as well as the diversity of indoor public space, people are extremely in need of sensory stimulation. It can help people better deal with the interaction between people and people, people and things, and people and space, relying on multi-sensory design to realize the comfort evaluation of the indoor environment, and help the indoor environment more in line with people’s growing experience needs.
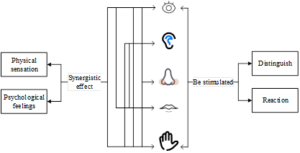
Multi-sensory experience refers to the stimulation of sensory functions from various aspects, starting from the human senses, so as to change the user’s feelings and influence the user’s inherent ideas. Multi-sensory experience refers to the process in which an individual receives external stimuli through the eyes, ears, nose, tongue, body and other organs to recognize and react to the properties of objective things. Multi-sensory experience is the process of physiological and psychological feelings after the synergistic effect of two or more sensory organs, which changes the traditional perception of the norm, but also intervenes in the psychological problems of people.
The specific performance of multisensory design is shown in Figure 1. Utilizing the five senses of human, the sensory experience is combined with the indoor spatial environment, so that people can get the design of sensory experience in the indoor spatial environment [23]. Through the experience of the five senses of feeling, the stimulus response to the surrounding environment, and feel the sensory functions in different forms of space. The integration of multiple senses such as vision, smell, touch, hearing, taste and so on in the five senses allows people to feel in the space with interactivity, three-dimensionality and comprehensiveness.
In the multi-sensory design of indoor space environment, increase the multi-sensory experience feeling. Combining people’s psychological and behavioral characteristics, we create diversified spaces with valuable participation and interaction in terms of the surrounding environment, time, location and other factors to form a functional space with multi-sensory experience.
Comfort is a state of mind, a pleasant feeling of relaxation and absence of pain. Interpersonal interaction spends most of its time in closed indoor spaces, and comfort is one of the most important factors affecting the efficiency of human interaction. An indoor space that makes people feel comfortable must first meet the comfort of each sense, including tactile thermal comfort and activity comfort, visual light environment comfort, and olfactory respiratory comfort [24].
Tactile comfort mainly includes temperature, humidity and activity comfort. In order to achieve the most comfortable temperature for human perception in an indoor space, it needs to be handled with a systematic, climate change sensitive design, complemented by passive heating and cooling means. Only when these design strategies are exhausted should active heating and cooling systems come into play. All active systems should be designed for hybrid building control, i.e. they can be switched between control and ‘free-running’ modes, ultimately providing adaptive options for occupants.
Visual comfort in a space is primarily a function of the light conditions in the interior space. The standard for visual comfort requires a light level of 500 lux and 1000 lux to activate the circadian system, a requirement that can be met at any time of the day when outdoors, but is extremely difficult to meet in indoor spaces.
Olfactory comfort refers primarily to the quality of air in indoor spaces. Controlled air movement during the day, such as through windows or the use of fresh air systems, can greatly improve summer comfort. In addition, buildings should be designed for ventilation cooling, which relies on high air exchange rates at night to cool the building structure.
The Predictive Mean Vote (PMV) model for indoor thermal comfort is a metric used to quantify and assess the comfort of indoor thermal environments [25]. The model is designed to predict the average sensation of a group of people regarding the thermal comfort of the environment in which they are located. The PMV model is based on a range of environmental and personal factors including air temperature, relative humidity, air flow rate, radiant temperature, clothing adiabatic value, and the metabolic rate of the human body through which the parameters are combined to assess the temperature sensation that people may feel, ranging from -3 (cold) to +3 (hot).The PMV is calculated using the following formula: \[\label{GrindEQ__1_} PMV=[0.303e^{-0.036} M+0.028]L , \tag{1}\] where \(L\) is the body load, then: \[\label{GrindEQ__2_} \begin{array}{l} {L=(M-W)-3.05\times [5.733-0.07(M-V)-P_{a} ]-0.4(W-M-58.15)} \\ {-0.0173M(5.87-P_{a} )-0.0014(34-t_{a} )-3.96\times 10^{-8} f_{ci} (t_{ci} +273)^{4} -f_{ci} (t_{ci} -t_{a} )} \end{array} . \tag{2}\]
Among them: \[\label{GrindEQ__3_} h_{c} =\left\{\begin{array}{ll} {2.38(t_{cl} -t_{a} )^{0.25} } & {2.38(t_{cl} -t_{a} )^{0.25} >12.1\sqrt{\nu _{a} } } \\ {12.1\sqrt{\nu _{a} } } & {2.38(t_{cl} -t_{a} )^{0.25} <12.1\sqrt{\nu _{a} } } \end{array}\right. . \tag{3}\]
The environmental variables are \(t_{a}\) for air temperature, \(v_{a}\) for air flow rate, \(P_{a}\) for air water vapor partial pressure, and \(t_{mrt}\) for average ambient radiation. Human activity is \(M\) the metabolic rate of the human body, \(W\) the mechanical work done by the human body. Clothing thermal properties are \(I_{c1}\) for the basic thermal resistance of clothing, \(t_{c1}\) for the outer surface temperature of clothing, \(h_{c}\) for the convection heat transfer coefficient, \(f_{c1}\) for the surface clothing area coefficient, which can be expressed as: \[\label{GrindEQ__4_} f_{cl} =1+0.3I_{cl} \tag{4}\]
If the body does zero external work, the PMV can be expressed as: \[\label{GrindEQ__5_} PMV=f(M,t_{a} ,t_{mrt} ,I_{cl} ,v_{a} ,\varphi ) . \tag{5}\]
Light environment comfort is the situation of human visual comfort evaluation of the environment in which they live. The creation of light environment generally has two parts: natural light source and artificial light source, and the most intuitive representation scale is the illuminance value [26]. Corresponding to different user groups and building functions, the illuminance of indoor space should choose different design values. The comfort of the light environment is a subjective judgment-based perceptual quantity, and the establishment of the mathematical model is based on Weber-Fechler. The generalized Weber-Fechler law is expressed as follows: \[\label{GrindEQ__6_} ds=kf\mathop{\scriptscriptstyle\leftharpoondown}\limits^{\displaystyle\rightharpoonup} (S)\frac{dR}{R^{m} } , \tag{6}\] where \(S\) is the incremental amount of sensation as a function of the amount of \(\; f(S)\) sensation, \(R\) is the amount of physical stimulation that produces the amount of sensation, and \(m\) is a constant index that varies with the amount of sensation. The mathematical model of visual comfort is as follows: \[\label{GrindEQ__7_} Z=a_{0} +a_{1} \ln E+a_{2} (\ln E)^{2} +\cdots a_{n} (\ln E)^{n} +\cdots , \tag{7}\] where \(a0,al,a2…\) is determined by experimental data, \(n\) is generally taken as 3\(\mathrm{\sim}\)5.
Lighting coefficient (C) is a relative value, because the outdoor illuminance often changes, will inevitably make the indoor illuminance with the change, so it can not be a fixed value. It is indoors at a given point on the plane by the full cloudy sky diffuse light produced by the illuminance and the same time, the same place, in the outdoor level by the full cloudy sky diffuse light produced by the illuminance of the ratio. That is: \[\label{GrindEQ__8_} C=En/Ew\times 100\% . \tag{8}\]
In the formula, \(En\) in the full cloudy sky diffuse light irradiation, indoor given plane at a point by the sky diffuse light generated by the illuminance, \(Ew\) in the full cloudy sky diffuse light irradiation, and indoor illuminance at a point at the same time, the same place, in the outdoor unobstructed horizontal plane by the sky diffuse light generated by the outdoor illuminance.
Illuminance uniformity is used to evaluate whether the distribution of indoor illuminance field is uniform an important indicator, you can use illuminance uniformity as an evaluation index to analyze the distribution of illuminance in the indoor light environment. Then: \[\label{GrindEQ__9_} \sigma _{E} =\frac{E_{\min } }{\bar{E}} , \tag{9}\] where \(\sigma _{E}\) is the uniformity of illumination, \(E_{\min }\) is the minimum value of illumination on the horizontal plane, and \(\bar{E}\) is the average illumination on the horizontal plane.
The basic principle of indoor wind environment
Wind pressure refers to when the wind blows through the building, impact on the windward side of the building, the wind deflection formation of vortex, resulting in a positive pressure greater than the atmospheric pressure. In the building upwind of the formation of winding stripping and leeward side of the return flow attached to the ground, resulting in less than atmospheric pressure of the negative pressure, this increase or decrease in atmospheric pressure collectively referred to as wind pressure. The resulting pressure difference prompts air flow, a phenomenon known as wind pressure under the role of natural ventilation. Wind pressure ventilation is the most common form of natural ventilation in buildings, this paper mainly applies the principle of wind pressure to rationally layout the space and air inlet and outlet to form a good indoor wind environment.
Airflow in the absence of interference from the building, the wind pressure is calculated as: \[\label{GrindEQ__10_} P=\frac{1}{2} K\rho _{\varepsilon } \cdot \nu ^{2} , \tag{10}\] where \(P\) is the wind pressure on the building surface, \(K\) is the wind pressure coefficient on the building surface, \(\rho _{e}\) is the outdoor air density, and \(\nu\) is the wind speed at the reference surface (usually located at the height of the building opening).
Natural ventilation in the building space relying only on the role of thermal pressure is less, in this study, but not too much detail, only to explore the relationship between thermal pressure and building factors.
The formula for calculating thermal pressure is as follows: \[\label{GrindEQ__11_} \Delta P=gH(\rho _{e} -\rho _{i} )\approx 0.043H(t_{e} -t_{i} ) , \tag{11}\] where \(\Delta P\) is the thermal pressure, \(g\) is the acceleration of gravity, \(H\) is the vertical distance from the centerline of the air inlet and outlet, \(\rho _{e}\) is the density of outdoor air, \(\rho _{i}\) is the density of indoor air, \(t_{e}\) is the outdoor air temperature, \(t_{i}\) is the indoor air temperature.
From the above formula, it can be seen that the size of the heat pressure and the height difference between the air inlet and outlet, indoor and outdoor air temperature difference.
Air Distribution Characteristics
The human body surface is more sensitive to the sense of blowing air, air temperature and wind speed is not appropriate will lead to discomfort, generally use the effective temperature difference \(\Delta ET\) to determine the comfort [27]. \(\Delta ET\) is to reflect the air temperature and wind speed in the air-conditioned area of the combined effect of comfort indicators, which is defined as: \[\label{GrindEQ__12_} \Delta ET=(t_{i} -t_{n} )-7.66(u_{i} -0.15) , \tag{12}\] where \(\Delta ET\) is the effective temperature difference, \(t_{i}\) is the temperature at the measurement point, \(u_{i}\) is the velocity at the measurement point, and \(t_{n}\) is the temperature in the working area.
Existing standards provide that when the \(\Delta ET\) at the measurement point is \(-1.75\sim 1.15K\) and \(u_{i} <0.35{\rm m/s}\), the temperature and wind speed at this measurement point can be considered comfortable for the human body.ADPI, as a comfort evaluation index, can be used to determine whether there is a sense of blowing wind, and to evaluate the thermal comfort effect of the combined effect of air temperature and wind speed on the human body. It is defined as the percentage of the points in the working area that meet the requirements of \(-1.75K<\Delta ET<1.1{\rm 5}K\) to the total number of measurement points, i.e.: \[\label{GrindEQ__13_} {\rm ADPI}=\frac{{\rm Inside\; count}}{{\rm The\; total\; number\; of\; points}} \times 100\% -1.75<\Delta {\rm ET}<+1.15 . \tag{13}\]
When \(ADPI\ge 80\%\), the indoor airflow organization is considered satisfactory.
Sense of blowing air
The blowing sensation is one of the most common thermal comfort dissatisfaction problems, and the blowing sensation defined in ISO7730 uses three parameters of speed, temperature and turbulence intensity to evaluate the percentage of dissatisfaction caused by the blowing sensation. Namely: \[\label{GrindEQ__14_} DR=(34-t)(v-0.05)^{0.62} (0.37vT_{u} +3.14) , \tag{14}\] where \(t\) is the temperature of the air at a point, \(v\) is the flow rate of the air at a point, and \(\tau _{u}\) is the turbulence intensity of the air at a point.
ASHRAE states that DR should not be greater than 25% of the allowable value at the point of measurement, and to ensure that personnel have good thermal comfort, the DR value should be as small as possible.
Human life perception consists of its sensory feelings, which is a collection of sensation plus perception. The combination of multi-sensory design and indoor environment aims to enhance people’s perception of indoor environmental space, make the indoor environment give people more comfort, promote people in the indoor space can feel more changes in the environment, to meet the needs of people’s richer spiritual perception.
Taking the building of a senior care institution in G city as the research object, on-site measurement of the indoor thermal environment of the building and subjective questionnaire survey of the indoor human thermal comfort are carried out with a view to evaluating the indoor factors affecting the thermal comfort. It provides a reference for the building renovation of the senior care institution to enhance the comfort of the indoor environment of the institution and to truly care for the elderly. Data were obtained through field visits, environmental tests and questionnaires, and the test was conducted from February 4, 2023 at 8:00 a.m. to April 9, 2023 at 8:00 p.m., taking into account that the buildings of the elderly institutions are generally used during the daytime.
During the test, the data of each measurement point before and after the test were recorded manually, and the indoor temperature parameters and indoor relative humidity parameters of each measurement point in each sample room were recorded automatically by the instrument every 15 min, and the black sphere temperature and air flow rate were recorded manually every 30 min. This time, the UT mini anemometer was mainly used to measure the indoor temperature and humidity changes, the black sphere temperature was obtained by the black sphere recorder, and the air flow rate was obtained by the PROVA wind speed and air volume recorder.
During the field survey, 120 questionnaires were sent out, of which 116 were valid. The age distribution of the subjects was generally 60-75 years old, and their activity status was sitting and resting as well as lying down and walking back and forth. The questionnaires mainly contained both objective and subjective contents, including the activity state of the respondents, the wearing situation, the basic information of the respondents, the evaluation of thermal sensation, and the thermal adaptation behavior. The activity questionnaire was filled out in a 30-min cycle at the same time as the field test. Considering that different locations and different activity forms will affect the subjective evaluation of the subjects, the questionnaire will be randomly sent to elderly people in different zones of the room in order to minimize the resulting data bias error. The thermal sensation voting values in the questionnaire were expressed using the ASHRAE 7-level index.
There are two types of rooms in the nursing home building, i.e., internal and external suites and single openings, and four typical rooms on different floors in the south and north directions are selected for data collection, i.e., the south suite, the north suite, the south openings, and the north openings, etc. Nursing homes in G city are centrally heated in winter, and the indoor temperatures during the heating period and during the period of heating outage are tested respectively. Figure 2 shows the distribution and change of indoor temperatures in the north-south oriented rooms during the test period. During the heating period, the average indoor temperatures in the north suite and north room were 23.84 ℃ and 24.15 ℃, and the average indoor temperatures in the south suite and south room were 24.48 ℃ and 23.97 ℃, with little difference between north and south oriented rooms, and all of them were within the comfort range of indoor temperatures for civil buildings in cold regions in winter (20 25 ℃) given by the national standard. During the test period after the heating was stopped, the average indoor temperatures in the north suite and the north open room dropped to 17.81 ℃ and 17.92 ℃ respectively, which were lower than the national minimum standard of 18 ℃ for winter indoor temperatures in cold regions. The average temperature difference before and after the stoppage of heating was 6.03 °C and 6.23 °C respectively, with a maximum drop of 25.80%. In comparison, the average indoor temperatures of the south suite and the south-facing room during the transition period were 20.65 ℃ and 21.06℃ respectively, which were still higher than the minimum standard of indoor temperature in winter and were at the lower limit of the comfortable temperature range. The temperature difference between the south-facing rooms before and after the heating cut-off was 3.83 °C and 2.91 °C respectively, with a drop of between 12.14% and 15.65%, which is a relatively small change and helps the human body to adapt and regulate the temperature.
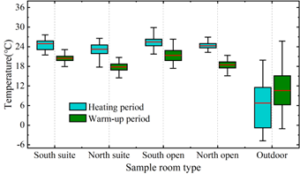
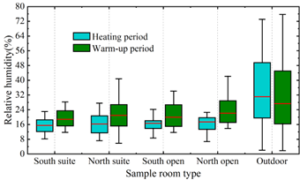
Figure 3 shows the distribution of indoor relative humidity in the north and south oriented rooms during the test period. During the test period before the heating was stopped, the average relative humidity was 16.23% and 18.65% in the north suite and north open room, respectively, and 16.12% and 17.96% in the south suite and south open room, respectively. During the test period after the heating was stopped, the average relative humidity in the north suite and open room was 20.74% and 22.69%, and the average relative humidity in the south suite and open room was 19.53% and 20.08%, respectively. The average relative humidity in the north-facing rooms was slightly higher than that in the south-facing rooms during the heating period, and the difference was larger after the heating was stopped. According to China’s indoor environment thermal comfort standard, the relative humidity set for summer rooms is 45% 60%, and the relative humidity set for winter rooms is 35% 55%, and the combined average relative humidity of the measured rooms is lower than the thermal comfort standard, showing a tendency to be on the dry side.
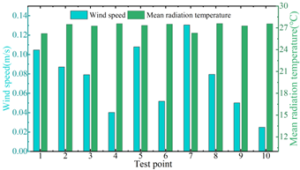
In the measurement process of indoor thermal comfort related indexes, this paper sets up a total of 10 different test points in four rooms, and adopts the wind speed test instrument given in the previous section to get the wind speed distribution of each test point. The measured air temperature, black sphere temperature and the relevant values of black sphere emissivity and black sphere radius are brought into the average radiation temperature calculation formula given earlier to obtain the average radiation temperature distribution at different test points. The specific distributions of the two are shown in Figure 4.
As can be seen from the figure, the wind speed at the measurement points is less than 0.2 m/s. According to the replacement ventilation design specification, the wind speed at the replacement vent does not exceed 0.4 m/s, and the air velocity at the dwell does not exceed 0.25 m/s in the sitting state, so the wind speed in this region meets the specification requirements. The wind speed is higher near the replacement vent point 6, and lower at other points near the heat source, the seat, and the glass curtain wall, resulting in a localized uneven distribution.
The average radiant temperature of all measurement points was 27.21 °C, with the maximum value of 27.59 °C at 12:00 a.m. at measurement point 8 and the minimum value of 26.22 °C at 12:00 a.m. at measurement point 1. In addition to measuring point 1 and measuring point 7, the radiant temperatures of other measuring points are all above 27 ℃, higher than the indoor standard value (26.5 ℃) in summer, and the higher outdoor ambient temperature leads to the higher temperature of the inner surface of the building envelope, which strengthens the effect of indoor radiant heat transfer. Since measurement point 7 was in the middle of the five replacement ventilation and protected from light, it was least affected by the effect of thermal radiation. The average radiant temperature fluctuated more uniformly throughout the test period.
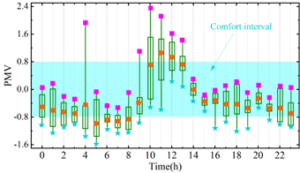
Based on the data of the questionnaire, combined with the results of the analysis of the temperature and humidity, wind speed and average radiation temperature of the elderly building, the indoor PMV value of the elderly in the elderly building is calculated and evaluated based on the human thermal comfort PMV evaluation model, and the improvement of indoor thermal comfort is proposed. The standard ISO7730 stipulates that the comfort zone of PMV is ±0.8, and the trend of indoor thermal comfort PMV for the elderly in senior buildings in winter is shown in Figure5.
The average value of PMV of indoor thermal environment in senior citizen buildings is -0.563, and the fluctuation range is between -1.2 and 1.6. Statistics on the measured data found that 69.18% of the total measured values were between -0.8 and 0.8, when the indoor temperature was between 22.5 and 25.7 °C, and the indoor environment was comfortable to meet the needs of the elderly.6.07% of the PMV values were above 0.8, which all appeared in the middle of the day, when the indoor temperature was 25.7 °C or more. The period of hot indoor thermal environment lasted for 2.5 to 4.5 hours per day. There were 24.75% PMV values below -0.8, when the indoor temperatures were all below 22.5 °C. The indoor environment was cold, and the points were all around 3 5 o’clock at night, when the outdoor temperatures were too low, and the indoor heat loss was large, with a difference of more than 2 °C from the comfortable indoor thermal environment.
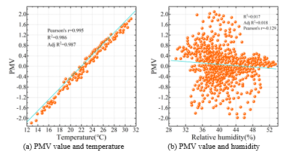
In order to further illustrate the correlation between the PMV values and the temperature and humidity of the indoor thermal environment, this paper carries out a linear regression analysis between the PMV values and the temperature and humidity. Figure 6 shows the linear regression results of PMV values with indoor temperature and humidity, where Figures 6(a) and (b) show the regression results of temperature and humidity, respectively.
The indoor air temperature is positively correlated with the calculated PMV values, and the PMV of the indoor thermal environment gradually becomes larger as the indoor temperature increases. When the temperature is less than 22.5 °C, the indoor PMV value is below -0.4 and the indoor thermal sensation is colder. When the indoor temperature is greater than 25.7 °C, the indoor PMV value is above 0.4, and the indoor thermal comfort is hot. Indoor humidity is negatively correlated with PMV value, with the rise of humidity, the indoor PMV value gradually decreases, when the indoor humidity is less than 52.14%, the indoor thermal comfort PMV value is greater than -0.8, the indoor environment is more comfortable. The comparison of R2 in the regression results reveals that temperature is the main factor affecting the thermal comfort of the indoor environment of the elderly buildings, and humidity has less influence on the thermal comfort of the indoor environment of the elderly buildings.
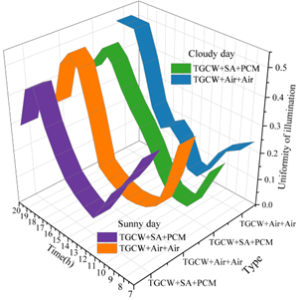
The indoor light environment of the senior citizen building will have different light illuminance and illuminance uniformity because of the choice of external glass curtain wall, thus, this paper carries out the comparative analysis of light illuminance under different working conditions for the senior citizen building under the construction of thermal insulation phase-change glass curtain wall (TGCW+SA+PCM) and three-layer air glass curtain wall (TGCW+Air+Air), respectively. Figure 7 shows the illuminance uniformity of the indoor light environment under different working conditions.
Under sunny conditions, the uniformity of the indoor illuminance of the insulated phase change glass curtain wall gradually decreases from 0.415 to 0.104 and that of the triple-layer air glass curtain wall decreases from 0.397 to 0.103 with the increase of time from 7:00 to 12:00, and the uniformity of the indoor illuminance of the two types of exterior glass curtain walls gradually increases with the increase of time from 12:00 to 18:00 and that of the three-layer air glass curtain wall decreases from 0.397 to 0.103 with the increase of time from 12:00 to 18:00. Uniformity gradually increased, and in the 18:00 20:00 time period, the indoor illuminance uniformity gradually decreased with the increase of time. The minimum (0.104, 0.103) and maximum (0.447, 0.512) values of indoor horizontal illuminance uniformity for the new insulated phase-change glass curtain wall and the three-layer air-glass curtain wall occur at 12:00 and 18:00, respectively.Under cloudy conditions, the minimum (0.072) and maximum (0.484) values of planar illuminance uniformity for the insulated phase-change glass curtain wall occur at 10:00 and 18:00, respectively. 10:00 and 18:00.The minimum value of the horizontal plane illuminance uniformity of the triple air-glass curtain wall is delayed by 1 hour. The minimum value of indoor illuminance uniformity is delayed by 1 hour for the sunny day condition compared to the cloudy day condition. The indoor illuminance uniformity for both sunny and cloudy conditions is less than 0.55, which is due to the large area of the shaded portion of the glass curtain wall, which makes the indoor illuminance uniformity in the same horizontal plane smaller.
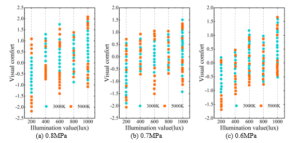
The visual comfort of the indoor light environment was calculated and normalized by combining the weights of each subjective evaluation index in existing studies. Since both the pressure and the associated color temperature of the light source belong to the stimulation of the human retina by different environments, and illuminance is the physical parameter for measuring visual comfort. Therefore, illuminance is used as the basic parameter to compare the integrated visual perception of different color temperatures under different atmospheric pressures, respectively. Figure 8 shows the results of the variability analysis of visual comfort at different color temperatures, where Figures (a) to (c) show the variation of visual comfort with atmospheric pressure from 0.8 to 0.6 MPa, respectively.
Visual comfort increases with increasing illuminance, and the increase in visual comfort is more significant when the illuminance value increases from 200 lux to 600 lux than from 600 lux to 1000 lux. Increasing the color temperature associated with the light source is more significant in improving visual comfort at illuminance values below 600 lux, while the effect of color temperature on visual comfort decreases significantly when the illuminance value exceeds 800 lux. In addition, the increase in color temperature at 0.6 MPa atmospheric pressure was more significant in improving visual comfort than at 0.8 MPa atmospheric pressure.
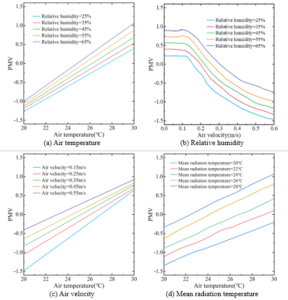
From the previous PMV model, it is clear that there are seven variables of PMV, i.e., human metabolism, external activity, clothing thermal resistance, pressure, air temperature, and average radiant temperature. Since the main discussion here is on the effect of environmental factors on PMV values, the parameters human metabolism and external activity are taken as constants here. In this paper, when solving the relationship between each air environment factor and PMV, a certain factor is taken as a variable, while other factors are taken as constants, and then according to the expression of PMV value, the calculation program of PMV is prepared by using the MATLAB language, and the results of the influence of air environment parameters on PMV value are obtained as shown in Figure 9 after running this program. Among them, Fig. 9(a) (d) shows the effects of air temperature, relative humidity, air velocity, and average radiant temperature on PMV value under different relative, respectively. According to the curve changes in the figure, the following conclusions are drawn:
When the air velocity, average radiation temperature and relative humidity are certain, the PMV value increases sharply with the increase of air temperature. For example, when the air velocity is 0.25 m/s and the relative humidity is 55%, the increment of PMV value caused by the change of air temperature from 20 ℃ to 30 ℃ is 1.75.
When the air velocity, air temperature and mean radiant temperature are certain, the PMV value will increase as the relative humidity increases. This is because, the higher the relative humidity, the greater the partial pressure of water vapor in the air, the less evaporation of human sweat, and its rate of increase will increase with the rise of relative humidity.
When the relative humidity, the average radiation temperature is certain, the air velocity elevation will lead to a decrease in the PMV value, and the rate of reduction will decrease with the increase in air temperature, when the air temperature rises to a certain temperature (about 28.5 ℃), the change in air velocity will have almost no effect on the PMV. Because then the outside ambient temperature is about equal to the average temperature of the human body surface, people and the outside world almost no convection heat transfer. When the air temperature is less than the average temperature of the human body surface, the greater the air velocity, the smaller the PMV value, that is, the stronger the cold feeling. When the air temperature is greater than the average temperature of the human body surface, the greater the air velocity, the greater the PMV value, that is, the stronger the feeling of heat.
When the air velocity, air temperature and relative humidity are certain, the PMV will increase with the increase of the average radiant temperature, and its rate of increase is almost constant with the increase of air temperature. When the air temperature is 20 °C, the change in PMV value caused by changing the average radiation temperature from 20 °C to 28 °C is 1.21, and when the air temperature is 30 °C, the change in PMV value changes less.
In summary, the higher the air temperature, the higher the average radiation temperature, the higher the relative humidity, the higher the wind speed, the higher the PMV value, i.e., the stronger the thermal effect of the air on the human body. The degree of influence of the four air environment factors, relative humidity, air temperature, mean radiant temperature and air velocity, on the thermal sensation of the human body changes with the increase of wind speed. When the wind speed is within a certain range, the degree of influence of the four factors on the human body thermal sensation in descending order is air temperature > air speed > average radiation temperature > relative humidity. When the wind speed is greater than a certain value, the influence of the four environmental factors on the human thermal sensation, in descending order, is air temperature > average radiant temperature > air velocity > relative humidity.
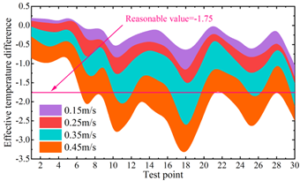
The human surface is more sensitive to the sense of blowing air, and inappropriate air temperature and air velocity will lead to discomfort, and the effective temperature difference is generally used to determine the comfort. Based on the relevant formulas of effective temperature difference and ADPI given in the previous section, this paper analyzes the effective temperature difference under different air velocities for different types of rooms with different measurement points in elderly buildings. The trend of effective temperature difference under different air velocities is shown in Figure 10.
As can be seen from the figure, the increase in air velocity leads to a larger range of fluctuations in the effective temperature difference. When the air velocity is 0.15 m/s and 0.25 m/s, the observation points are within a reasonable range, and the value of ADPI at this time is 100%. When the air velocity increases to 0.35 m/s, seven of the observation points are not within a reasonable range, and the value of ADPI at this time is 80% of the critical value of air distribution. And when the air velocity reaches 0.45 m/s, more points in the observation points are not in the reasonable range, at which time the value of ADPI is already below 50%. The results show that although the increase of air velocity can reduce the concentration of airborne pollutants more effectively, the increase of wind velocity will affect the effective temperature difference, which will reduce the comfort of indoor people. Therefore, while considering the indoor air quality should also take into account the requirements of human comfort, and should not blindly pursue the indoor air quality and increase the air velocity.
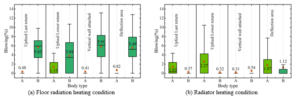
In this paper, after exploring the effect of indoor air environment on PMV values, the comfort variation of indoor air with different airflow organizations is further verified by combining the sense of blowing. In terms of the comfort of indoor environment in elderly institutions, this paper obtains the comfort of blowing air in the human sleeping area with different airflow organization conditions by using two different openings of radiant floor as well as radiator heating, combined with the blowing air sense calculation method given in the previous section. Figure [11] shows the results of air blowing comfort, of which Figure 11(a) (b) are the results of radiant floor and radiator heating conditions, respectively.
In the radiant floor heating condition, the blowing sensation in the human sleeping area B is stronger than that in the human sleeping area A. The air convection near the external window affects the airflow in the area near the human body. Radiator heating conditions in the up-fed back, up-fed down-fed back, variable work area air supply human sleep zone A by the air supply airflow is stronger than the sense of blowing, radiator heating air formed by convection weakened by the outside window cold airflow convection effect on the human sleep zone B, the degree of airflow disturbances in the region is reduced. The vertical wall attached due to the air supply airflow above the ground to form a thin layer of air lakes, the two human sleep area near the sense of blowing is very weak. By analyzing the sense of blowing wind in different situations, it helps to carry out the optimization design of the indoor environment and helps the elderly to better perceive the comfort of the indoor environment.
As the level of urbanization increases and people’s living standards improve, the number of finished construction buildings being built is gradually increasing. At the same time, indoor environmental comfort and air quality issues have received widespread attention. In winter and summer seasons, the natural ventilation method reduces the comfort of the indoor heat and humidity environment, while the opening time is also greatly restricted. Relying on the results of multisensory indoor environmental comfort evaluation, multisensory design strategies for indoor environments are proposed with the aim of providing more comfortable indoor environments and improving the level of people’s indoor living environments.
At the planning level, the first step is to conduct overall planning for the land conditions around the transportation complex. Secondly, it is necessary to utilize and transform the original environmental conditions of the surrounding sites as much as possible based on the thinking and planning of the site conditions. Focus on how to integrate the original greening, landscape, water, plaza and other elements of the site with the site’s underground public space to improve the internal environment and the feeling of use. Finally, combining the characteristics of its own three-dimensional layout and multi-dimensional ecological stitching with urban space, it can link different urban spaces by setting up underground corridors to form a rich spatial system.
At the architectural level, the design principles of the planning level should be continued, and natural elements should be introduced as much as possible. Consideration should be given to increasing the use of semi-open spaces and flexible spatial layout. Increasing the area of envelope openings to enhance the openness of space requires a combination of the advantages and disadvantages of different types of buildings, which should be more fully considered at the design stage, and a design form that better utilizes the advantages should be selected. Flexible spatial layout can be used to introduce natural light into the indoor space by placing nodes such as light wells, atriums, skylights and sunken plazas. Reasonably set up air inlets, exhaust ducts, ventilation wells and wind paths to promote natural ventilation and create landscape nodes to enrich the internal environment. In cold and frigid regions, the area of the building façade in the south direction should be increased as much as possible in order to utilize solar radiation to increase the heat gain of the building and reduce the energy consumption of building heating.
This paper evaluates the changes in indoor environmental comfort through the three dimensions of thermal environment, light environment and air environment, and proposes corresponding improvement measures for the problems existing in the indoor environment.
If there is no air-conditioning equipment inside the room in summer, natural ventilation alone cannot effectively reduce the indoor temperature. Select the louvered sunshade that is better for the indoor light environment, and simulate the amount of solar radiation blocked by different louvered sunshade. In summer, the amount of outdoor solar radiation is large, and it is more appropriate to use full shading, and in winter, it is more appropriate to use half shading.
After adopting louvered sunshade, set windows on the inner wall of the room. Open the windows on both sides in summer to increase indoor air flow and achieve the effect of through-the-room wind.
Modify the indoor air-conditioning system into a centralized air-conditioning system and set up temperature sensors. When the indoor temperature reaches the thermal comfort temperature it stops running, reducing the cold discomfort of the air-conditioned classroom in summer.
In order to meet the need for energy efficiency in buildings, it is very necessary to reduce the frequency of using artificial light sources. There are several different measures that can be taken when designing interior lighting:
Set up enough switches or light control facilities to encourage users to switch on and off artificial light sources. Change the way the switches in the room are turned on, changing the original row of switches along the depth of the room to perpendicular to the direction of the room.
Setting the illumination control element at the artificial light source to automatically turn on the artificial light source when the indoor illumination does not satisfy the value stipulated in the standard, and determining the intensity of the artificial light source according to the strength of the natural light.
Automatically control the lighting system according to the time change, the automatic control system can set up different programs to close or adjust the parameters of the artificial light source according to the time.
Both in summer and winter, when indoor doors and windows are closed, carbon dioxide collects in the room and reduces indoor air quality. Therefore, the ventilation between indoor and outdoor should be strengthened.
Intelligent ventilation. Set up carbon dioxide concentration sensors indoors for pollutant monitoring and set the windows so that they can be opened and closed automatically. When the indoor carbon dioxide concentration exceeds 1200 ppm, the windows are automatically opened for ventilation.
Mechanical ventilation. Using the air conditioning system, an infrared sensing system can be set up to adjust the amount of fresh air according to the number of people in the room.
A timer is set to monitor the number of people in the room, so that if the number of people in the room reaches the limit and the window closure time reaches the limit, the window will be opened automatically.
This paper carries out the assessment of indoor environmental comfort under multi-sensory design through the three dimensions of thermal environment, light environment and air environment, and puts forward the related strategies of multi-sensory design for indoor environmental comfort by combining the results of actual data analysis.
In the temperature and humidity changes of different types of indoor rooms in the north-south direction, the temperature difference between the south-oriented rooms before and after the warming stop decreased between 12.14% and 15.65%, which is a small change and helps the human body to adapt to and regulate the temperature. And the indoor humidity in the north and south oriented rooms showed a large difference before and after the heating stop, and the average relative humidity in the north oriented rooms was slightly larger than that in the south oriented rooms. The average value of PMV of indoor thermal environment in the elderly building is -0.563, and the fluctuation range is between -1.2 and 1.6.
When the insulated phase change glass curtain wall is applied in the building, the uniformity of indoor illuminance is less than 0.55 under both sunny and cloudy conditions. The visual comfort of the indoor light environment increases with increasing illuminance, and when the illuminance value rises from 200lux to 600lux, the improvement of visual comfort is more significant than that from 600lux to 1000lux.
The higher the air temperature and the average radiant temperature, the higher the relative humidity and the higher the wind speed, the higher the PMV value, i.e., the stronger the thermal effect of the air on the human body. When the air velocity is 0.15m/s and 0.25m/s, the ADPI value of indoor air distribution characteristics is 100%. When the air velocity exceeds 0.4m/s, its ADPI value is lower than 50%.
Relying on the assessment results of indoor thermal environment, light environment and air environment comfort, corresponding multi-sensory design strategies are proposed from two dimensions of planning and architectural design, and relevant measures for optimizing indoor environment comfort are given from heat, light and air, which provide guidance for improving indoor environment comfort.