
At present, China’s building energy consumption accounts for about one-third of the total energy consumption of the whole society, and high energy consumption and high emissions have become an important factor restricting the sustainable development of the construction industry and even the whole society. Promoting the green transformation of urban housing projects can provide opportunities for the rapid development of green building in China, and can also properly solve the problems of engineering quality defects and irrational design in housing, realizing a win-win situation or even a multi-win situation [1,2].
Adequate funding is a strong guarantee for the construction of urban housing projects, so the number of channels to raise funds also affects the sustainable development of urban housing [3]. Compared with traditional housing projects, green building pursues full life cycle savings, which can be more easily cost control, however, the incremental cost of advanced green technology reflected in housing construction makes the funding problem of housing projects increasingly prominent [4-6]. If we want the green transformation of urban housing to continue to develop, relying only on the government’s financial input will certainly not be able to satisfy, and we must find more kinds of financing methods, which requires innovation in the financing mode of the green housing project, seeking diversified financing methods, and better attracting diversified investors for the financing of the green housing project [7-10]. It can be foreseen that the housing problems brought about by the urbanization process and demographic changes, under the increasingly perfect housing security system, coupled with the introduction and practice of financial innovation tools, China’s future housing pattern and housing market will develop in a more fair and reasonable direction, thus effectively improving the living conditions and quality of life of the general public [11-14].
Literature [15] investigated the global trends in energy production and consumption in the context of rising global temperatures and emphasized the importance of corporate green financing strategies and policies to promote sustainable economic development through the development of necessary infrastructure by identifying the growth patterns of resources. Literature [16] used structural equation modeling to analyze the impact of green banking practices on the environmental performance of banks and the sources of green financing for private commercial banks, and the results showed that green project financing by banks has a significant positive impact on the environmental performance of banks. Literature [17] describes feasible options for green financing of renewable energy projects, including enhancing the roles of public financial institutions and non-bank financial institutions in long-term green investments, utilizing spillover taxes to increase the rate of return of green projects, etc., and verifies them through an example study. Literature [18] constructs a green credit financing model under the hard constraint of carbon emission and compares it with the traditional trade credit financing model to get the optimal equilibrium solution under the two modes, which can be used for manufacturers to set up a suitable green investment scope and realize a win-win situation with suppliers. Literature [19] studied the purchasing decision problem of a two-level green supply chain with financial constraints and financing credit support, and found that in the case of financing, the retailer would purchase options to realize risk hedging and gain more benefits in the green production of the supply chain.
Literature [20] examines the impact of real estate project finance on the quality and affordability of improved housing and finds that banks’ credit activities for housing improvement projects hit the supply of high-quality apartments but raised the average apartment rent. Literature [21] explores the challenges of stimulating energy efficiency and green financing policies in the case of housing energy efficiency retrofits in the UK, showing that long-term government policies targeting energy efficiency and financing models are key to reducing the risk of financial investment and facilitating the implementation of housing energy efficiency retrofit projects. Literature [22] points out that the energy transformation of housing reduces the negative impacts of the real estate bubble, not only increases the land transfer income of real estate enterprises, but also boosts the real economy, in which green finance plays an important role. Literature [23] suggests three feasible approaches to improve energy efficiency in residential buildings, such as the mandatory approach of setting energy efficiency standards, the voluntary approach of establishing energy ratings, and the incentive approach of introducing fiscal measures, and the study finds that private sector financing deals have a strong energy housing market driver.
In this paper, the ecological footprint theory is used as a comprehensive evaluation of the level of green transformation of urban housing projects, and the evaluation of green buildings is carried out from the total ecological footprint, ecological carrying capacity, ecological deficit and ecological footprint reduction of urban housing. The specific impact of SME green financing on the green transformation of urban housing projects is analyzed from the effect of SME green financing issuing green bonds.
The SME financing model and urban housing project development can only be transformed in the direction of green development in order to adapt to the current social development trend and then realize sustainable development. The article first proposes a green financing model for SMEs based on the combination of PPP and REITs, and analyzes the specific impact of SMEs’ green financing on promoting the green transformation of urban housing projects. Then a new evaluation method of green development level of urban housing projects based on ecological footprint theory is proposed, which reacts to the green transformation level of urban housing projects through ecological footprint, ecological deficit and ecological footprint reduction. Relying on the double difference model to establish a multi-temporal DID model, the specific role of green bonds in SME green financing is found to promote the green transformation of urban housing projects. The short-term market effect of SMEs’ green financing and its environmental benefits in the green transformation of urban housing projects are analyzed based on the regression results.
The financing mode of small and medium-sized enterprises (SMEs) in the era of digital economy has changed to a large extent, and relying on traditional financing methods cannot be effectively adapted to the green transformation of urban housing projects. It is necessary to further innovate the green financing mode of small and medium-sized enterprises to coordinate the green transformation of urban housing projects, so as to effectively promote the improvement of social and livelihood standards and accelerate the urbanization process. Relevant departments should adjust the green financing model of SMEs and the development structure of urban housing projects from the perspective of the current economic situation in order to promote the coupled and coordinated development of green financing of SMEs and urban housing projects.
Small and medium-sized enterprises (SMEs) are the source of stimulating innovation, promoting competition and maintaining stability in the market economy, and they are the inexhaustible driving force for the sustainable and healthy development of the economy. In the context of the digital economy, how to realize the green technological innovation of SMEs and optimize their own green financing model has become a problem that SMEs must face in order to improve their economic efficiency.
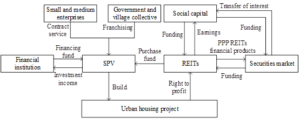
Driven by the PPP financing model of urban housing projects, SMEs can rely on real estate investment trusts (REITs) to realize the construction of the green financing model, which is to issue income certificates of housing project assets to raise funds from investors in society, and distribute the income generated from real estate, such as rents and property management, to the investors in accordance with the method of dividend payment, so that the REITs investors can get the benefits from the real estate investment trusts, which makes the REITs investors get the benefits from the real estate investment trusts. This makes REITs investors obtain a relatively long-term, stable investment income [24].
The framework of PPP+REITs financing model for SMEs to realize green financing is shown in Figure 1, which relies on the government to obtain the right to use the construction land, and invites qualified enterprises to participate in the construction of the housing project and sign a PPP agreement through public bidding. After reaching the PPP agreement, the government and the enterprise jointly funded the formation of a special project company (SPV), which is responsible for the development and construction of the construction land and housing project and related ancillary facilities. At this time, and then REITs will be introduced into the model, the enterprise capital, private restricted funds, insurance funds and other social capital collection, funds from the community at large investors flow into the urban housing project, can effectively release the PPP project precipitation of the basic gold, realize the PPP mode of small and medium-sized enterprises to exit safely, back to the social capital can be invested in new urban housing projects, to achieve the sustainable development of capital virtuous circle.
Under the background of “double carbon”, no matter from the viewpoint of the pillar status and role of urban housing projects in improving the national living standard, or from the viewpoint of the current construction situation of urban housing projects, the green transformation and development of urban housing projects is an inevitable choice [25]. The green transition development of urban housing projects already has a certain foundation, the following from the policy basis, development basis, demand basis, supply basis four aspects are analyzed.
Policy foundation: A series of policy measures from the construction, water management, waste management, greening, carbon emissions and other aspects together to promote the green transformation of urban housing projects, the promotion of green building materials, assembly building and steel structure housing, etc., the green transformation of the development of urban housing projects put forward a wider range of requirements.
Development basis: Economic and social development, the improvement of residents’ income level and living standard have provided support for the green transformation development of urban housing projects.
Demand base: The urban population continues to increase, the scale of the mobile population between cities has expanded significantly, and the green willingness to pay still has a large upward space, which contributes to the green transformation of urban housing projects.
Supply base: The green transformation of urban housing projects has achieved certain results, but the existing housing has poor safety durability and incomplete supporting facilities, making it difficult to meet the people’s pursuit of a better life.
SMEs will issue corresponding green bonds under the green financing model, which in turn can, to a certain extent, the green transformation of urban housing projects. The myriad paths of green bonds issued by SMEs for green financing to promote the green transformation of urban housing projects are shown in Figure 2. Mainly through the improvement of debt structure, the establishment of green reputation, improve resource utilization rate of the three path transmission.
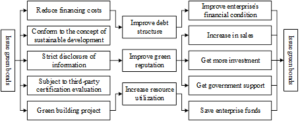
Compared with other financing instruments, green bonds are significantly superior in terms of financing costs, disclosure costs and issuance costs. SMEs can obtain the funds needed for green projects at lower financing costs and provide them with sufficient cash flow. Therefore, by investing in green bonds of SMEs, it can effectively reduce the cost of capital, ease the pressure of capital, improve the rate of return of capital, thus reducing the financial risk, thus making the capital turnover of urban housing projects smoother, thus promoting the development of urban housing projects in the direction of “green”.
The issuance of green bonds conveys the social responsibility of SMEs, helps SMEs establish a good green image, and is conducive to the establishment of the green image of SMEs, and most of the funds obtained must flow to the green field for the development of environmentally friendly projects, which can enhance the reputation of enterprises. Thus, it can obtain more consumption amount, investment and policy support, which plays a positive role in promoting the green transformation of urban housing projects.
The issuance of green bonds can promote the improvement of the ecological environment, and the issuance of green bonds by small and medium-sized enterprises can enhance the resource utilization rate of green building projects, which not only protects the ecological environment, but also saves the resources of urban housing projects in the long term, increases the funds for urban housing projects, and promotes the green transformation of urban housing projects.
The basic formula of the ecological footprint theory: Ecological footprint (EF) refers to the sum of biologically productive land area (including land and water) needed to produce the resources and services consumed by a certain population, and to consume and absorb the wastes generated by these populations. As a tool for quantitatively measuring urban sustainability, the ecological footprint describes the current and future state of the world facing humanity from a new perspective [26].
The equalization factor is calculated as: \[\label{GrindEQ__1_} r_{j} =\frac{\bar{P}_{j} }{p} \quad (j=1,2,\cdots ,6) , \tag{1}\] where \(\tau _{j}\) is the equilibrium factor for ecologically productive land in category \(j\), \(\bar{p}_{j}\) is the global average productivity of land in category \(j\), and \(p\) is the global average productivity of all land.
The productivity factor is calculated as Eq: \[\label{GrindEQ__2_} y_{j} =\frac{\bar{p}_{j}^{i} }{\bar{p}_{j} } \quad (j=1,2,\cdots ,6) , \tag{2}\] where \(y_{j}\) is the yield factor of ecologically productive land in category \(j\), \(\bar{p}_{j}^{i}\) is the average productivity of land in category \(j\) in the \(i\) city, and \(\bar{p}_{j}\) is the global average productivity of land in category \(j\). The yield factor and equilibrium factor used in the calculations of this paper come from Wackemagel’s calculations.
The calculation of the ecological footprint is based on two basic facts: first, humans are able to determine the amount of resources, energy, and waste produced by the vast majority of their own consumption. The second is that these resources and wastes can be converted into biologically productive areas for their production as well as their absorption. The classification of human consumption and absorption of the waste produced is attributed to the area of the six categories of productive land (arable land, grassland, forest land, land used for fossil energy, built-up land and water). The formula is as follows: \[\label{GrindEQ__3_} EF=N\times ef , \tag{3}\] \[\label{GrindEQ__4_} ef=\sum _{i=1}^{n}(r_{i} c_{i} /p_{i} ) , \tag{4}\] where \(EF\) is the total ecological footprint, \(N\) is the population size, \(ef\) is the ecological footprint per capita, \(i\) is the type of goods and inputs consumed, \(r_{i}\) is the equalization factor, \(c_{i}\) is the per capita consumption of \(i\) types of goods, and \(p_{i}\) is the world average production capacity of \(i\) types of goods consumed.
The calculation of ecological carrying capacity mainly takes into account arable land, pasture land, forest land, built-up land, and waters, on top of which we also take into account the area of biodiversity conservation by deducting 10% in accordance with the usual practice. Then: \[\label{GrindEQ__5_} EC=N\times ec \tag{5}\] \[\label{GrindEQ__6_} ec=\sum _{j=1}^{n}(a_{j} r_{j} /y_{j} ) , \tag{6}\] where EC is the total ecological carrying capacity of the city, \(N\) is the number of population, \(ec\) is the ecological carrying capacity per capita, \(j\) is the type of biologically productive land, \(\gamma _{j}\) is the yield factor, \(r_{i}\) is the equilibrium factor, and \(a_{j}\) is the per capita area of biologically productive land.
Ecological surplus is determined by ecological carrying capacity and ecological footprint, i.e.: \[\label{GrindEQ__7_} ED/ES=EF-EC . \tag{7}\]
If the ecological footprint of the region exceeds the ecological carrying capacity that the region can provide, an ecological deficit occurs. If the regional ecological footprint is less than the ecological carrying capacity of the region, an ecological surplus is indicated. When the phase is reduced to zero, it shows regional ecological balance.
Ecological Footprint Model for Urban Housing Project Construction Stage: During the construction phase, the physical system of fixed assets is formed through the occupation of resources and energy and the emission of waste, and its main impact on the environment is the consumption of construction materials and the occupation of construction land. The use of large quantities of construction materials and components, and the consumption of waste in the process of materialization create a huge ecological footprint. The variety of construction materials consumed is so large that it is impossible and unnecessary to list and analyze them all statistically. The use of construction materials is analyzed according to Pareto’s law. A small number of building materials are used in significant quantities, accounting for almost 85% of all building materials consumed, while the vast majority of building materials are used in very small quantities, and calculations of these materials have a negligible impact on the results. \[\label{GrindEQ__8_} EF_{{\rm build}} =EF_{{\rm Labour}} +EF_{{\rm Materials}} +EF_{{\rm machine}} , \tag{8}\] \(EF_{{\rm build}}\) is the ecological footprint occupied during the construction phase of the green building in national hectares (nha), \(EF_{{\rm Labour}}\) is the ecological footprint of the food consumed by the construction workers during the construction of the project, and \(EF_{{\rm Materials}}\) is the ecological footprint of the consumption of the materials that make up the project’s entity, which includes the land used for the construction of the building, steel, timber, cement, glass, sand, etc. The main construction machinery includes tower cranes, excavators, mixers, and so on. \(EF_{{\rm machine}}\) is the ecological footprint that mainly includes all kinds of materials and energy consumed by the construction machinery in the process of using, the main construction machinery including tower crane, excavator, mixer, etc.
The ecological footprint calculation formula of manpower is expressed as: \[\label{GrindEQ__9_} EF_{{\rm Labour}} =\sum E_{{\rm Labour}} =\sum Q_{n} \times e_{1n} , \tag{9}\] \(Q_{n}\) is the consumption of the \(n\)nd resource in the ecological footprint of labor, and \(e_{1n}\) is the unit ecological footprint of the \(n\)th resource. However, in this paper, only the food consumption of construction workers is considered, so n = 1, which is the ecological footprint of the food resources occupied by a production worker consumed in one working day. Then: \[\label{GrindEQ__10_} e_{1n} =\sum c_{1j} e_{1j} , \tag{10}\] \(c_{1j}\) is the amount of food type \(j\) consumed by a worker in a workday, and \(e_{1j}\) is the ecological footprint per unit of food type \(j\) consumed. Then: \[\label{GrindEQ__11_} e_{1j} =r_{k} \times (1/p_{1j} ) ,\tag{11} \] \(k\) is the ecologically productive land type, \(r_{k}\) is the equalization factor for the \(k\)rd land type, and \(p_{1j}\) is the national average unit production capacity for the \(j\)th food product.
The expression for calculating the ecological footprint of the material is: \[\label{GrindEQ__12_} EF_{{\rm Materials}} =\sum E_{{\rm Materials}} =\sum Q_{n} \times e_{2n} , \tag{12}\] \(Q_{n}\) is the consumption of material \(n\) in the ecological footprint of the material and \(e_{2n}\) is the unit ecological footprint of material \(n\). Then: \[\label{GrindEQ__13_} e_{2n} =\sum c_{2j} e_{2j} \tag{13}\]
\(c_{2j}\) is the amount of resource \(j\) consumed per unit weight of material, and \(e_{2j}\) is the ecological footprint per unit of resource \(j\) consumed. Then: \[\label{GrindEQ__14_} e_{2j} =r_{k} \times (1/p_{2j} ) , \tag{14}\] \(p_{2j}\) is the national average unit production capacity of resource \(j\).
The mechanical ecological footprint calculation is expressed as: \[\label{GrindEQ__15_} EF_{{\rm machine}} =\sum E_{{\rm machine}} =\sum Q_{n} \times e_{3n} , \tag{15}\] \(Q_{n}\) is the consumption of the \(n\)nd resource in the ecological footprint of machinery, and \(e_{3n}\) is the unit ecological footprint of the \(n\)th resource in the ecological footprint of machinery, i.e., the ecological footprint occupied by the resources consumed by one shift of a type of machinery. Then: \[\label{GrindEQ__16_} e_{3n} =\sum c_{3j} \times e_{3j} , \tag{16}\] \(c_{3j}\) is the consumption of resource \(j\) consumed by the machinery in one shift, and \(e_{3j}\) is the ecological footprint per unit of resource \(j\) consumed by the machinery. Then: \[\label{GrindEQ__17_} e_{3j} =r_{k} \times (1/p_{3j} ) , \tag{17}\] \(p_{3j}\) is the national average unit production capacity of resource \(j\).
Ecological footprint reduction model for urban housing projects: The ecological footprint reduction (DEF) of an urban housing project is the sum of the ecological footprints reduced by each ecological indicator of the urban housing project. According to the design of the ecological footprint model of urban housing projects in the previous section, the total ecological footprint reduction is composed of land-saving ecological footprint reduction, energy-saving ecological footprint reduction, material-saving ecological footprint reduction and environmental protection ecological footprint reduction [27]. The details are as follows:
The core of land saving in urban housing projects is to reduce the use of arable land by improving the efficiency of land utilization. This paper calculates the land-saving ecological reduction of urban housing projects from four aspects, which are site selection, per capita occupancy rate, location, and supporting facilities. Its specific calculation formula is as follows: \[\label{GrindEQ__18_} DEF_{{\rm Site \;Selection}}=(S_{{\rm Equilibrium\; factors\; of\; cultivated\; land}}-S_{\rm{The\; land\; types\; of\; Equilibrium\; factors}})\times\frac{\rm{Project \;area}}{\rm{Age\; limit}}, \tag{18}\] \[\label{GrindEQ__19_} DEF_{{\rm Per\; capita\; occupancy}} =(D_{{\rm Area\; per\; capita}} -D_{{\rm Per\; capita\; land\; area}} )\times {\rm Land\; balance\; factor} , \tag{19}\] \[\label{GrindEQ__20_} \begin{array}{rcl} {DEF{}_{{\rm location}} } & {=} & {\frac{(d_{{\rm This\; project\; is\; from\; the\; bus\; stops}}} { d_{{\rm The\; distance\; from\; the\; bus\; stop\; was\; compared}} )}} {\times DEF_{{\rm Comparative\; project\; location}} } \end{array} , \tag{20}\] \[\label{GrindEQ__21_} \begin{array}{rcl} {DEF{}_{{\rm Set\; the\; application}} } & {=} & {\frac{(T_{{\rm This\; item\; solves\; the\; problem\; of\; equal\; enjoyment}}} { T_{{\rm Figure\; out\; the\; average\; person's\; pleasure\; ratio\; for\; comparison\; items}} }}\\[2mm]&&\times{F{}_{{\rm Compare\; project\; supporting\; facilities}} } ,\end{array} \tag{21}\]
When calculating the ecological footprint of energy-saving indicators, their energy consumption is usually converted into electricity consumption, considering the difficulty of data acquisition and the complexity of calculation. The ecological footprint of every 1kw-h of electricity consumed in China is 0.00023ghm², so the formula for the reduction of energy-saving ecological footprint is: \[\label{GrindEQ__22_} DEF_{{\rm Energy\; conservation}} =0.00023\times {\rm Power\; saving\; per\; capita} . \tag{22}\]
The use of recycled materials is the main consideration in the building material saving segment. The use of recycled materials saves the consumption of building materials and thus reduces the ecological footprint. This can be achieved by converting the recycled materials used into a corresponding ecologically productive land area, which is then converted into a uniform land area based on the equalization factor. The formula for this is: \[\label{GrindEQ__23_} DEF_{{\rm Nodal\; wood}} =D_{{\rm Per\; capita\; use\; of\; energy-saving\; materials}} \times S_{{\rm Corresponding\; equilibrium\; factor}} . \tag{23}\]
The main measurements of environmental protection are carbon dioxide emissions and greening rate, so the reduction of environmental protection ecological footprint can be reflected by calculating carbon dioxide reduction and greening rate. Usually carbon dioxide reduction can be converted into forest land indicator, so the formula for calculating the environmental ecological footprint reduction is: \[\label{GrindEQ__24_} DEE_{CO_{2} {\rm \; }{\rm Emission\; reduction}} =D_{{\rm Annual\; carbon\; dioxide\; reduction\; per\; capita}} -5.2\times 0.62 , \tag{24}\] \[\label{GrindEQ__25_} DEF_{{\rm Ratio\; of\; green\; space}} =S_{{\rm Per\; capita\; green\; area}} \times \frac{S_{{\rm The\; balanced\; factor\; of\; pasture}}}{ N_{{\rm Service\; life}}} , \tag{25}\] \[\label{GrindEQ__26_} DEF_{{\rm Environmental\; protection}} =DEF_{CO_{2} {\rm \; }{\rm Emission\; reduction}} +DEF_{{\rm Ratio\; of\; green\; space}} . \tag{26}\]
The ecological goal of the green transformation of urban housing projects is to make the reduction of the ecological footprint of green buildings over conventional buildings equal to the reduction of the overall ecological goals of society. Therefore, the criterion for the green transformation of urban housing projects is to compare the ecological footprint reduction of the project with the ecological deficit of the region where the project is located; if the ecological footprint reduction is greater than the ecological deficit of the region, then the criterion for the green transformation of urban housing projects has been achieved; if not, then the green transformation of urban housing projects has not been achieved.
The Double Difference Model (DID) is an econometric method for estimating causal effects, the basic idea of which is to consider public policy as a natural experiment, and in order to assess the net impact of the implementation of a policy, the entire sample data is divided into two groups, one that is affected by the policy, i.e., the treatment group, and the other that is not affected by the same policy, i.e., the control group [28]. Select an individual economic indicator to be considered, according to the first difference before and after the implementation of the policy (time) to get two groups of changes in the amount, after the first difference can be eliminated the heterogeneity of the individual does not change over time, and then the two groups of changes in the amount of the second difference, in order to eliminate the incremental changes over time, and ultimately get the net effect of the implementation of the policy.
Assume that individual \(i\) is in group \(G_{i} \in \{ 0,1\}\) (where \(G_{i} =0\) denotes the control group and \(G_{i} =1\) denotes the treatment group), time \(T_{i} \in \{ 0,1\}\) (where \(T_{i} =0\) denotes pre-policy and \(T_{i} =1\) denotes post-policy), and that the grouping and the timing of the policy are randomized. \(Y_{i}\) denotes the observable outcome for individual \(i\), with \(Y_{i}^{N}\) denoting the potential outcome when individual \(i\) is not affected by the policy, and \(Y_{i}^{I}\) denoting the potential outcome when individual \(i\) is affected by the policy. If the treatment variable is denoted by \(I_{i}\), then the observable outcome for individual \(i\) can be expressed as: \[\label{GrindEQ__27_} Y_{i} =I_{i} Y_{i}^{I} +(1-I_{i} )\cdot Y_{i}^{N} , \tag{27}\] where \(I_{i} =G_{i} \cdot T_{i}\). The above equation, also known as the individual treatment stability assumption, assumes that the effect of Individual \(i\) being affected by the policy is a fixed constant: \[\label{GrindEQ__28_} \tau =E[Y_{i}^{I} |T_{i} =1,G_{i} =1]-E[Y_{i}^{N} |T_{i} =1,G_{i} =1] ,\tag{28} \] where \(Y_{i}^{N} |T_{i} =l,G=l\) denotes the outcome when Individual \(i\) is assumed to be unaffected by the policy, an unmeasured variable, generally referred to as the counterfactual outcome. It is now assumed that the potential outcome variable for Individual \(i\) when unaffected by policy satisfies the linear form, i.e.: \[\label{GrindEQ__29_} Y_{i}^{N} =\alpha \cdot T_{i} +\beta \cdot G_{i} +X_{i} \theta +\varepsilon _{i} , \tag{29}\] where \(X_{i}\) denotes the observable characteristics of \(i\) also known as covariates (containing constants that are assumed to be unaffected by policy and satisfy the exogeneity assumption) and \(\varepsilon _{i}\) denotes the unmeasured factors of individual \(i\). It is also assumed to have a mean of 0 and independent of the grouping and time variables, denoted as: \[\label{GrindEQ__30_} \varepsilon _{i} \bot (G_{i} ,T_{i} ) . \tag{30}\]
Assuming that the conditions are also known as parallel trends, the desired expression for the linear form can be derived as: \[\label{GrindEQ__31_} E[Y_{i}^{N} T_{i} =1,G_{i} =1]=\alpha +\beta +X_{i} \theta . \tag{31}\]
Can be obtained from the fixed constants: \[\label{GrindEQ__32_} E[Y_{i}^{I} |T_{i} =1,G_{i} =1]=\alpha +\beta +X_{i} \theta +\tau . \tag{32}\]
Combining the observable results and the linear form yields a linear regression model that includes the policy effect \(\tau\) as: \[\begin{aligned} \label{GrindEQ__33_} {E[Y_{i} |T_{i} ,G_{i} ]}=&{T_{i} \cdot G_{i} \cdot (\tau +\alpha T_{i} +\beta G_{i} }{+X_{i} \theta )+(1-T_{i} \cdot G_{i} )\cdot (\alpha T_{i} +\beta G_{i} +X_{i} \theta )} \notag\\ {}=&{\alpha T_{i} +\beta G_{i} +\tau T_{i} \cdot G_{i} +X_{i} \theta }. \end{aligned} \tag{33}\]
In order to obtain a consistent estimator for the double-difference approach at least the following three conditions need to be met:
The parallel trend condition, which means that the trend of the outcome effect is the same for the treatment and control groups in the absence of the policy intervention, or that the trend of the outcome effect is the same for the treatment and control groups before the policy intervention.
The SUTVA condition, where the policy intervention only affects the treatment group and does not have an interaction effect on the control group, or where the policy intervention does not have spillover effects.
Linear form condition, where the potential outcome variable satisfies a linear relationship with the treatment and time variables.
Housing is both a livelihood and a development issue. In order to adapt to the development trend of new urbanization and changes in the relationship between supply and demand in the real estate market, the current urban housing supply system of “guarantee + market” is being improved, and guaranteed rental housing has become one of the most important ways to meet the housing needs of new citizens, young people and other groups. The green transformation of urban housing projects is to improve the ecological living environment of the people, enhance the quality of urban housing projects, and promote the achievement of the goal of “dual-carbon” and sustainable development in the process of housing construction.
The data in this paper comes from the statistics of green financing and urban housing projects of SMEs in Guangdong Province from 2012 to 2022. The survey adopts stratified, multi-stage, proportional PPS sampling and regional random sampling to understand the development of green finance for SMEs, and the results are highly representative. The CMDS data used in this paper is public data, so the reliability and validity of this data is reliable and accurate. In this paper, SMEs and urban housing projects in Guangdong Province are selected as research objects, and after data screening to eliminate outliers, the green transformation of urban housing projects is mainly studied in terms of SME characteristics and urban housing projects.
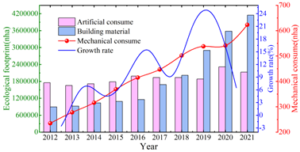
Based on the ecological footprint calculation model of urban housing projects in the ecological footprint theory given in the previous section, this paper calculates the ecological footprint of urban housing projects in Guangdong Province from 2012 to 2021. The ecological footprint of the planning and construction stage mainly includes labor consumption, construction materials and mechanical consumption, and the corresponding methods are used to solve the data to obtain the ecological footprint level of urban housing projects in the planning and construction stage as shown in Figure 3. The left green axis is the result of calculating the ecological footprint of manual consumption and construction materials, the right red axis is the ecological footprint of mechanical consumption, and the blue axis is the trend of growth rate.
Through data analysis, it can be found that in the overall construction phase of urban housing projects in Guangdong Province from 2012 to 2021, the ecological footprint of manual consumption is in the trend of increasing, then decreasing and then increasing, but the overall change is relatively stable, with the change range between -8.1% and 22.86%. In terms of the overall ecological footprint of construction materials, it has been in a linear upward trend, with an ecological footprint of 4,145,679nha in 2021, an increase of 32,505,370nha compared with 2012, or an increase of 2.63 times. The ecological footprint of machinery consumption is in a linear upward trend, and the ecological footprint of machinery consumption in the overall construction process of urban housing projects in Guangdong Province grows from 235nha in 2012 to 623nha in 2021, with a growth rate of 165.11%, and an average annual growth rate of 16.51%. Overall, the ecological footprint of urban housing projects in Guangdong Province is in an upward trend. The ecological footprint of urban housing projects in Guangdong Province was 2646800nha in 2012, and the ecological footprint at the end of 2021 was 6274166nha, an increase of 3627366nha in ten years, an increase of 137.04%. The annual increase first rises, then falls, then rises and then falls again, with the largest increase in 2020 at 23.16%, and the lowest and negative increase in 2013 at -2.56%. This is due to the fact that the construction area and sales area of urban housing projects in Guangdong Province are on an upward trend, which leads to a continuous increase in the ecological footprint.
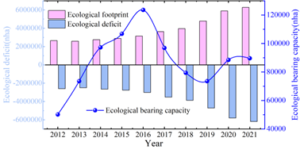
Ecological carrying capacity refers to the total area of ecologically productive land that a region can have without jeopardizing the productivity and functional integrity of the ecosystem in question. The ecological carrying capacity of urban housing projects in Guangdong Province is calculated based on the solution method of ecological carrying capacity of urban housing projects given in the previous section. According to the ecological surplus deficit formula, combined with the ecological footprint and ecological carrying capacity of urban housing projects in Guangdong Province, it is possible to derive the ecological deficit of urban housing projects in Guangdong Province as shown in Figure 4.
From the figure, it can be seen that the ecological deficit level of urban housing projects in Guangdong Province from 2012 to 2021 is gradually expanding, and the ecological footprint of urban housing projects in Guangdong Province is in a state of severe ecological deficit, i.e., the development of urban housing projects in Guangdong Province is in a state of unsustainable development. Through data analysis, it is found that the ecological deficit level grows from 2596,658 nha in 2012 to 6184,558 nha in 2021, with an increase of 3587,900 nha, or 138.17%. From the perspective of supply and demand, the actual ecological demand for urban housing projects exceeded the supply by a multiple of 70 times in 2012, and decreased in 2015-2017, with none of the actual demand exceeding the supply by a multiple of 55 times, but gradually increased in 2018-2021, with the actual ecological demand for urban housing projects exceeding the supply by a multiple of 90 times by 2021, indicating that the development of urban housing projects has an increasingly serious impact on the ecological environment.
The ecological deficit performance of different land types is shown in Table 1. Among the land types, the ecological deficit of grassland accounts for the smallest proportion, arable land and waters account for a larger proportion and are in dynamic change, and forest land and built-up land are more stable. Secondly, from the perspective of time, the ecological deficit of arable land is in a decreasing trend, from 50.18% in 2012 to 20.46% in 2021, a decrease of 59.23%. The share of ecological deficit of watershed is on an upward trend, reaching 43.51% in 2021, 28.05 percentage points higher than in 2021. The proportion of grassland is small but in a decreasing state, decreasing by 86.08%, and the proportion of forest land and built-up land fluctuates less and is in a stable state. Analyzing the reason is mainly due to the rapid development scale of urban housing projects, major developers come one after another, the area occupied by cultivated land is rapidly expanding, which brings great pressure to the protection of cultivated land.
| Year | Ploughing | Woodland | Grass | Waters | Built |
| 2012 | 50.18 | 22.38 | 0.79 | 15.46 | 11.19 |
| 2013 | 48.27 | 22.49 | 0.51 | 17.78 | 10.95 |
| 2014 | 45.36 | 25.49 | 0.62 | 17.95 | 10.58 |
| 2015 | 44.78 | 25.17 | 0.72 | 16.78 | 12.55 |
| 2016 | 42.63 | 26.72 | 0.63 | 17.49 | 12.53 |
| 2017 | 36.79 | 25.36 | 0.51 | 25.76 | 11.58 |
| 2018 | 28.53 | 31.03 | 0.18 | 30.14 | 10.12 |
| 2019 | 23.27 | 28.14 | 0.16 | 38.27 | 10.16 |
| 2020 | 20.18 | 26.18 | 0.13 | 36.24 | 17.27 |
| 2021 | 20.46 | 24.07 | 0.11 | 43.51 | 11.85 |
The green design of urban housing projects pursues a state of balance with nature and satisfies an open settlement space design, which is manifested in the planning and design as well as the use stage, mainly in the use stage of land saving, water saving, energy saving, material saving, environmental protection as well as green transportation and humanistic and harmonious space measures. Based on the ecological footprint reduction calculation method for urban housing projects given in the previous section, the calculation of ecological footprint reduction for urban housing projects in Guangdong Province in 2022 is based on the data of urban housing projects in Guangdong Province. Table 2 shows the results of the ecological footprint reduction calculation of urban housing projects in Guangdong Province in 2022.
As can be seen from the table, the total ecological footprint reduction in the planning and construction phase of urban housing projects after the green transformation is 10,377.85 nha, of which the ecological footprint reduction of energy saving and energy utilization, material saving and material resource utilization is relatively large, reaching 3959.73 nha and 5548.94 nha respectively, which indicates that in the process of green transformation of urban housing projects, the energy and materials of housing construction should be taken into full consideration and the ecological footprint reduction should be calculated. Fully consider the energy and material resource utilization of housing construction, use energy-saving building materials and equipment at the initial stage of construction, and advocate the comprehensive and holistic consideration of the natural ecological environment, on the basis of which the ecological footprint reduction of the urban housing project created is the highest, in order to provide support for its green transformation.
| Item | Index | DEF (nha) | Total (nha) | Ratio (%) |
| Section and outdoor environment | Soil collection | 4.51 | 14.75 | 0.14 |
| Utilization of underground space | 10.24 | |||
| Energy efficiency and energy utilization | Solar saving | 1503.78 | 3959.73 | 38.16 |
| Conservation | 1776.43 | |||
| Boiler saving | 679.52 | |||
| Water conservation and water utilization | Medium water recovery | 69.91 | 130.07 | 1.25 |
| Water assembly | 60.16 | |||
| Use of materials and materials | Building joint | 5548.94 | 5548.94 | 53.47 |
| Environmental strategy quality | Waste water utilization | 217.65 | 288.48 | 2.78 |
| Garbage disposal | 70.83 | |||
| Green traffic | Car saving | 115.37 | 115.37 | 1.11 |
| Humanistic harmony space | Energy efficiency consumption | 320.51 | 320.51 | 3.09 |
Based on the data of urban housing projects in Guangdong Province in 2022, the total ecological footprint of the construction phase of urban housing projects in Guangdong Province in 2022 was found to be 57,264,481nha, while the ecological carrying capacity of urban housing projects in 2022 was calculated to be 131,159nha. The ecological deficit caused by the planning and construction phases of urban housing projects was: \[\label{GrindEQ__34_} EF-EC=5726481-131159=5595322nha . \tag{34}\]
According to the formula, the total reduction of ecological footprint of green buildings developed and constructed in urban housing projects in Guangdong Province during 70 years of operation is: \[\label{GrindEQ__35_} \begin{array}{l} {DEF=\sum _{70}(14.75+3959.73+130.07+288.48)+5548.94+115.37+320.51 } =5344279.17nha \end{array} . \tag{35}\]
According to the evaluation standard \(DEF/(EF-EC)>1\) in green building can be rated as green building, the construction index of urban housing project in this paper is an extension of the evaluation index and standard of green building to form the evaluation index and evaluation standard of urban housing project, so it can be evaluated the greenness of urban housing project in Guangdong Province with the evaluation formula of green building. Then the greenness of urban housing projects in Guangdong Province is: \[\label{GrindEQ__36_} \frac{DEF}{EF-EC} =\frac{5344279.17}{5595322} \approx 0.955 . \tag{36}\]
After the above calculation, it is not difficult to find that the greenness of urban housing projects in Guangdong Province is about 0.955, which is still a small ecological deficit, but compared with the ecological deficit of urban housing projects in 2012-2021, which is more than 50 times or even hundreds of times, it is gradually starting to develop in the direction of green and energy saving. 2022 urban housing projects in Guangdong Province will be developed in the process of building has already saved a considerable amount of resources and energy. Resources and energy, and have certain advantages in terms of ecological footprint, which can effectively help urban housing projects realize green transformation.
The overall carbon emissions of China’s real estate and construction industries account for about 40% of the country’s carbon emissions, making them both pillars of the national economy and major energy consumers, and a key area for green carbon reduction. Accelerating the green transformation of the development mode and implementing a comprehensive conservation strategy, it is imperative for urban housing projects to transform to green and low-carbon. At the same time, with the continuous development of the level of digital economy, SME green financing provides a new opportunity for the green transformation of urban housing projects, prompting the public to put forward more demands on the living environment and quality. Therefore, under the double demand of green financing development of small and medium-sized enterprises and healthy life of the military and civilians, the transition to green low-carbon and healthy living mode is an inevitable choice for the transformation and development of urban housing projects.
Based on the paths related to the green transformation of urban housing projects in Guangdong Province facilitated by SME green finance given in section 2.1.3, the total ecological footprint (EF) of urban housing projects in Guangdong Province is used as the dependent variable, and its specific results have been calculated in chapter 3. This paper chooses the level of green bonds issued by SME green finance (Green) as the independent variable, and the explanatory variable of this paper is the cross-multiplier term (Green × Post) of green bonds issued by SME green finance (Green) and the time dummy variable (Post). Drawing on existing related studies, this paper examines the impact of green bonds issued by SME green finance on the green transformation of urban housing projects in Guangdong Province through the multi-temporal double difference method (DID). The Green dummy variable is set, when Green is 1, it means that the enterprise has issued green bonds during any period of the sample, and enters the treatment group. When Green is 0, it means that the enterprise has not issued green bonds during the sample period, and enters the control group. Set Post time dummy variable, if the enterprise issued green bonds in the current year, then the value of the current year and the following years assigned to 1, for the issuance of green bonds before the year with no green bonds issued by the enterprise uniformly assigned to 0.
Referring to the existing studies on the ecological footprint of green transition of urban housing projects and green finance of small and medium-sized enterprises (SMEs), enterprise size (Lnsize), return on equity (ROE), equity concentration (TOP), gearing ratio (LEV), and average financing cost (Cost) are selected as control variables.
Based on the basic mathematical idea of double difference model, this paper examines the impact of green bonds issued by SMEs’ green financing on the green transformation of urban housing projects in Guangdong Province by constructing a multi-temporal double difference model. In order to avoid missing variables, the regression is conducted by controlling the year and industry. The specific model is as follows: \[\label{GrindEQ__37_} EF_{i,t} =\alpha _{0} +\alpha _{1} Green_{i,t} \times Post_{i,t} +\alpha _{2} \sum Control_{i,t} +\sum Year +\sum Indry +\varepsilon . \tag{37}\]
The above model contains two differentials, one for the change in urban housing projects in the treatment and control groups before and after the issuance of green bonds issued by SMEs for green financing, and the other for the difference between firms in the treatment group that issued green bonds and urban housing projects in the control group that did not issue green bonds. The cross-multiplication term Green \(\mathrm{\times}\) Post of green bonds (Green) and time dummy variable (Post) indicates the net effect of issuing green bonds on the green transformation of urban housing projects. If the coefficient \(\alpha _{1}\) of the cross-multiplier term Green \(\mathrm{\times}\) Post is significantly less than 0, it indicates that issuing green bonds has a significant impact on reducing the total ecological footprint of the green transformation of urban housing projects. \(\sum Control_{i,t}\) denotes each control variable, \(\sum Year\) denotes year effect, \(\sum Indry\) denotes industry effect, and \(\varepsilon\) is the random error term.
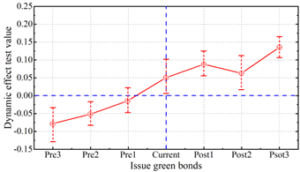
An important precondition for analyzing impact effects using the DID model is to satisfy the parallel trends assumption, which means that the two sample groups must be comparable before the shock or policy occurs. If the treatment and control groups are somewhat different ex ante, then the model results will not represent the net effect of the variable. Therefore, we use the event study method to test for parallel trends in the sample by generating and regressing the interaction term between the year dummy variable and the treatment group dummy variable as an explanatory variable, with the coefficients of the interaction term reflecting the differences between the experimental and control groups before the implementation of the green bonds for green financing for SMEs. Based on this, we generate the dummy variables of the three years before the policy and get the interaction terms, named Pre1 Pre3, correspondingly, the interaction terms after the issuance of green bonds of SMEs green financing are denoted by Post, and then the interaction terms are regressed as explanatory variables. Figure 5 shows the test results of the dynamic effect of SMEs’ green financing issuing green bonds on the total ecological footprint of green transformation of urban housing projects in Guangdong Province.
As can be seen from the figure, the coefficient of the interaction term fluctuates around the value of -0.1 to 0 before the implementation of green bonds by SMEs’ green financing, while the dynamic effect of the total ecological footprint of urban housing projects’ green transformation is significantly positive and does not fall back over time in the year of green bond implementation and in the following years. This indicates that the experimental group and the control group are indeed comparable, and the incentives of green bonds of SMEs’ green financing for green transformation of urban housing projects do not have time lag and have long-term positive guiding effects. This shows that green bonds issued by SMEs’ green financing are beneficial to the green transformation of urban housing projects in Guangdong Province.
This paper selects the panel data of SMEs’ green financing from 2012 to 2022 to analyze the effectiveness of the policy of issuing green bonds in promoting the level of green transformation of urban housing projects in Guangdong Province, and the double difference method is able to do the control of time effect as well as the control effect of individual effect.
In order to guarantee the accuracy of the experimental results, this paper excludes the serious missing data, the 27 SMEs that have issued green bonds as the experimental group, and the rest of the SMEs as the control group, if the coefficient of the interaction term is positive, then SMEs’ green financing issuance of green bonds will have a positive impact on the total green transformation ecological footprint of urban housing projects, and the regression results are shown in Table 3. Models (1) and (2) in the table are the regression results of the green transformation of urban housing projects in Guangdong Province with a single independent variable and the addition of control variables, respectively, and the *,**,*** distributions denote the significant level of 10%, 5%, and 1%, and the robust errors are in parentheses, the same as below.
The results of model (1) show that the coefficient of the interaction term between SMEs’ green finance issuance of green bonds and the dummy variable is 5.162 and is significantly positive at the 1% significance level. The interaction term coefficient of the regression after adding each control variable in model (2) is 4.059 and is also significantly positive at the 1% significance level. The significant decrease in the coefficients of the explanatory variables after the addition of the control variables in the table indicates that the regression results of the baseline experiment without the addition of the control variables are significantly overestimated, indicating that the addition of the control variables has improved the accuracy of the results. The results of this experiment show that the issuance of green bonds by SMEs in green financing can significantly increase the level of green building development in urban housing projects in Guangdong Province, which is conducive to the green transformation of urban housing projects in Guangdong Province.
| Variable | Model (1) | Model (2) |
| (Con_) | 7.241***(0.516) | -1.748(1.306) |
| Green × Post | 5.162***(1.429) | 4.059***(1.183) |
| Lnsize | – | -9.147***(1.296) |
| ROE | – | -1.327***(0.548) |
| TOP | – | -4.279**(2.348) |
| LEV | – | 3.758***(1.035) |
| Cost | – | -1.793***(0.724) |
| R-squared | 0.074 | 0.307 |
| Individual fixation effect | YES | YES |
| Time fixation effect | YES | YES |
In order to ensure the accuracy of the regression results, this paper will carry out the robustness test through the placebo test, replacing the dependent variable and introducing the green bond issuance time indicator. In the placebo test assumes that there is also a relevant policy to intervene before the green bond policy is implemented, and regression is carried out by setting the virtual green bond issuance time, at which time the interaction term coefficients are still continued to be observed. If if the interaction term coefficient of the regression on this basis is not significant, it means that the regression results are credible. The ecological footprint of the green transition of urban housing projects is replaced with ecological carrying capacity, using Time as a new dummy variable in the double difference model, to which values of 1 and 0 are assigned to indicate 2014 and after and before 2014, respectively. As a result, the robustness test results are obtained as shown in Table 4. Where models (1) to (3) are the results of placebo test, replacement of dependent variable and time change test respectively.
From the results of model (1), it can be seen that the coefficient of the interaction term is not significant, indicating that it passes the placebo test. That is, the positive impact of SMEs’ green financing issuing green bonds on the green development of urban housing projects is not caused by other factors, which means that the regression results above are robust. The coefficient of the interaction term in model (2) is 4.279, which means that there is a positive effect of SMEs’ green financing issuance of green bonds on the development of green transformation of urban housing projects. And it is significant at 5% level, which is basically consistent with the empirical results above and strongly strengthens the robustness of the experiment in this paper. The coefficient of the interaction term in model (3) is not significant, i.e., the proposal of the green bond policy in 2014 did not affect the green development of urban housing projects in Guangdong Province in the general environment, but waited until the SMEs really started to issue green bonds in the process of green financing, and the green bonds brought a positive effect on the green transition development of urban housing projects. It is basically consistent with the empirical results above, which strongly strengthens the robustness of the experiment in this paper.
| Variable | Model (1) | Model (2) | Model (3) |
| (Con_) | 7.948***(1.649) | 2.629***(4.048) | 7.793***(1.157) |
| Green × Post | -1.978(2.443) | 4.279**(2.175) | 0.158(0.942) |
| Lnsize | 6.471(0.592) | 1.743***(0.372) | 1.843***(0.195) |
| ROE | 6.513***(1.862) | 1.543(1.427) | -0.554***(0.238) |
| TOP | 0.951(4.728) | -7.328***(1.834) | -2.572*(1.346) |
| LEV | -4.383(2.875) | -4.332(2.518) | -5.717***(1.573) |
| Cost | -10.742***(9.881) | 2.663(3.248) | -5.791**(2.414) |
| R-squared | 0.331 | 0.201 | 0.175 |
| Individual fixation effect | YES | YES | YES |
| Time fixation effect | YES | YES | YES |
To address the impact of green bond issuance by SMEs green financing on their short-term market, this paper uses a time-length model to calculate their cumulative abnormal returns (CAR) and analyzes these returns through a t-test to thereby assess the short-term impact of green bond issuance on SMEs green financing. In order to assess the statistical significance of the impact of a particular event on stock prices, a t-test can be executed on the cumulative abnormal returns (CAR) to determine whether they significantly deviate from zero. This analysis centers on testing whether events, such as the issuance of green bonds by firms, have a statistically significant impact on green financing. Accordingly, the following original hypothesis (H0) is formed, which is that the cumulative abnormal return (CAR) is equal to zero, implying that the event of green bond issuance by the firms under study has no significant effect on their green financing. The test of this hypothesis aims to confirm that if CAR is significantly non-zero, it can be inferred that the event has a significant impact on green financing, thus providing an insight into the relationship between green financing and market response of SMEs.
Firm M in the dataset is selected as the study case, which issued green bonds on May 30, 2021, and its abnormal return (AR) and cumulative abnormal return are solved using the market model to obtain the results of AR and CAR as shown in Table 5.
From the data in the table, it can be observed that Firm M’s first green bond issuance has a significant short-term impact on its green financing efficiency. Specifically, the anomalous return (AR) exhibits a range of fluctuations from -2.42% to 5.71% in the 15 trading days before and after the base date surrounding the issuance event. During this period, the number of days in which positive abnormal returns are recorded in the five trading days following the announcement exceeds the number of days prior to the announcement date, indicating an increase in the frequency of positive abnormal returns after the announcement. From the statistical significance test, the p-value of the t-test is 0.002, which is much lower than the significance level of 0.01, allowing this paper to reject the null hypothesis \(H_0\). This result confirms that the first issuance of green bonds by Firm M has a significant positive impact on its green financing. This analysis not only highlights the market impact of green financial instruments, but also emphasizes the importance of green bonds as an indication of SMEs’ commitment to green development and its role in enhancing investor confidence and driving up share prices.
| Time | AR | CAR | Time | AR | CAR |
| 2021/5/30 | -1.51% | -1.54% | 2021/6/16 | -1.68% | -0.43% |
| 2021/6/1 | -1.53% | -2.93% | 2021/6/17 | 1.75% | 1.35% |
| 2021/6/2 | 5.71% | 2.71% | 2021/6/18 | -0.61% | 0.69% |
| 2021/6/3 | 1.02% | 3.72% | 2021/6/19 | 1.52% | 2.25% |
| 2021/6/6 | -1.94% | 1.75% | 2021/6/22 | 1.79% | 3.87% |
| 2021/6/7 | -2.42% | -0.72% | 2021/6/23 | -0.47% | 3.57% |
| 2021/6/8 | -0.79% | -1.46% | 2021/6/24 | -1.68% | 1.85% |
| 2021/6/9 | 0.05% | -1.35% | 2021/6/25 | -0.42% | 1.42% |
| 2021/6/10 | -0.53% | -1.87% | 2021/6/26 | 0.39% | 1.79% |
| 2021/6/15 | 3.14% | 1.16% | 2021/6/28 | -1.35% | 0.45% |
| 2021/6/16 | -1.68% | -0.51% | 2021/6/29 | 0.91% | 1.37% |
SMEs’ green financing can enhance their short-term market behavior by adopting the discovery of green bonds, and urban housing projects will further strengthen their investment in green buildings under the drive of the market, which is mainly reflected in the environmental benefits of urban housing projects. Panyu District, Guangdong Province, is selected as the object of study, and the environmental benefits of urban housing projects in the district are analyzed under the support of green bonds of SMEs’ green financing, and the specific results are shown in Table 6.
| Housing project | Group A | Group B | Group C | Group D |
|---|---|---|---|---|
| The construction scale is 22.92*104 m² | Two-star green building | Two-star green building | Two-star green building | Two-star green building |
| The land is occupied by the land (*104 m²) | 4.27 | 3.02 | 8.45 | 7.18 |
| Total area of the project | 18.63% | 13.18% | 36.87% | 31.33% |
| Building efficiency | 72.18% | 72.18% | 72.18% | 72.18% |
| Total area of the project * Building efficiency | 13.45% | 9.51% | 26.61% | 22.61% |
| Renewable energy utilization | 22.09% | 21.48% | 22.19% | 15.72% |
| Total area of the project * Renewable energy utilization | 4.12% | 2.83% | 8.18% | 4.93% |
| Non-traditional water utilization | 60.15% | 0.05% | 2.76% | 45.78% |
| Total area of the project * Non-traditional water utilization | 11.21% | 0.01% | 1.02% | 14.34% |
| The amount of recirculating construction materials is used | 11.48% | 8.75% | 7.48% | 9.79% |
| Total area of the project * The amount of recirculating construction materials is used | 2.14% | 1.15% | 2.76% | 3.07% |
The environmental benefit analysis of urban housing projects by issuing green bonds under the green financing model of SMEs reveals that the issuance of green bonds by SMEs with green financing can help urban housing projects achieve a building energy efficiency rate of 72.18%, a renewable energy utilization rate of 20.06%, a utilization rate of non-traditional water sources of 26.58%, and a recyclable building material usage ratio of 9.12%. In carrying out the construction of urban housing projects, the resource utilization rate of construction materials has been greatly improved, the internal consumption of material resources in urban housing projects has been reduced, better environmental benefits have been generated, and the sustainable development and green transformation of urban housing projects has been realized.
Aiming at the two-way promotion path between SMEs’ green financing and green transformation of urban housing projects, this paper innovatively proposes to utilize the ecological footprint theory to evaluate the green transformation of urban housing projects, and explores the impact of SMEs’ green financing on the green transformation of urban housing projects by combining with the double-difference model.
The ecological footprint of urban housing projects in Guangdong Province is in an upward trend from 2012 to 2021. The ecological footprint of urban housing projects in Guangdong Province increased by 36,273,366 nha in ten years, an increase of 137.04%, with the annual increase increasing, then decreasing, then increasing and then decreasing, with the largest increase of 23.16% in 2020, and the lowest increase and negative increase in 2013, with an increase of only -2.56%.
After the green transformation, the ecological footprint reduction of urban housing projects in Guangdong Province during the planning and construction phase totaled 10,377.85 nha, of which the ecological footprint reductions of energy saving and energy use, material saving and material resource use were relatively large, reaching 3,959.73 nha and 5,548.94 nha, respectively.
The greenness of urban housing projects in Guangdong Province in 2022 will be about 0.955, and a small ecological deficit still exists, but compared with the ecological deficit from 2012 to 2021 it has been gradually developing in the direction of green energy saving, which provides a development basis for promoting the green transformation of urban housing projects in Guangdong Province.
SME green financing through the issuance of green bonds to promote the green transformation of urban housing projects to produce dynamic changes in the ecological footprint, whenever the issuance of green bonds to enhance 1 percentage point, the green transformation of urban housing projects will enhance the ecological footprint reduction of 4.059 percentage points. The larger the ecological footprint reduction, the faster the green transformation trend of urban housing projects in Guangdong Province.
The issuance of green bonds under the green financing model of SMEs helps to improve their short-term market efficiency, and also enhances the utilization rate of green building materials in urban housing projects to a certain extent, providing reliable financial support for realizing the green transformation of urban housing projects.
In the future, this paper will also pay real-time attention to the progress of green building strategy transformation and development of urban housing projects in Guangdong Province, analyze the green financing operation of small and medium-sized enterprises (SMEs), the implementation of the new track of transformation, and study the problems in the process of transformation and the direction of the future transformation of the green building strategy and the new track according to the actual situation of the implementation of the strategy. The construction of urban housing projects in Guangdong Province will also maintain the strategic development of steady progress, striving for the design of advanced planning, the development of a conservation-oriented development model, and the provision of scientific programs for the development of the whole life cycle of green eco-cities. It will also continue to inherit the green building quality gene under the leadership of the concept of sustainable development, consolidate its established advantages in the field of green and low-carbon, promote the realization of high-quality development, continue to realize the people’s dream of living in an ecological, scientific, healthy and intelligent city, and unleash the vitality of green and sustainable development of the entire city.
2022 Guangdong General Colleges and Universities Characteristic and Innovative Project “Research on the Influence of Regional Digital Economy on Enterprise Green Finance – Based on Empirical Data of Guangdong Province” (Project No. 2022WTSCX314);
Guangdong Province Philosophy and Social Science Planning 2023 General Project “Digital Economy Enabling Guangdong Province SMEs Green Financing Mechanism and Path Research” (Project No.: GD23CYJ17).