
Global warming and climate change drive the use of renewable energy systems [1], [2]. Fossil fuel emissions and methane gas contribute to these effects, raising temperatures [3]. Efforts to lower \(CO_2\) emissions, improve energy efficiency, and transition to renewable resources and hydrogen have gained international attention [4, 5]. 14% of the Earth’s surface is deserts and face arid conditions, droughts and dust storms [1]. For that reason, those extreme regions are in urgent need for renewable energy systems, as well as reduced carbon footprints. Those environment friendly systems are vital in addressing climate change and global warming. Deserts in particular face unique challenges in regions with hot climates. In those areas, reducing the \(CO_2\) emissions and adopting renewable energy systems is essential.
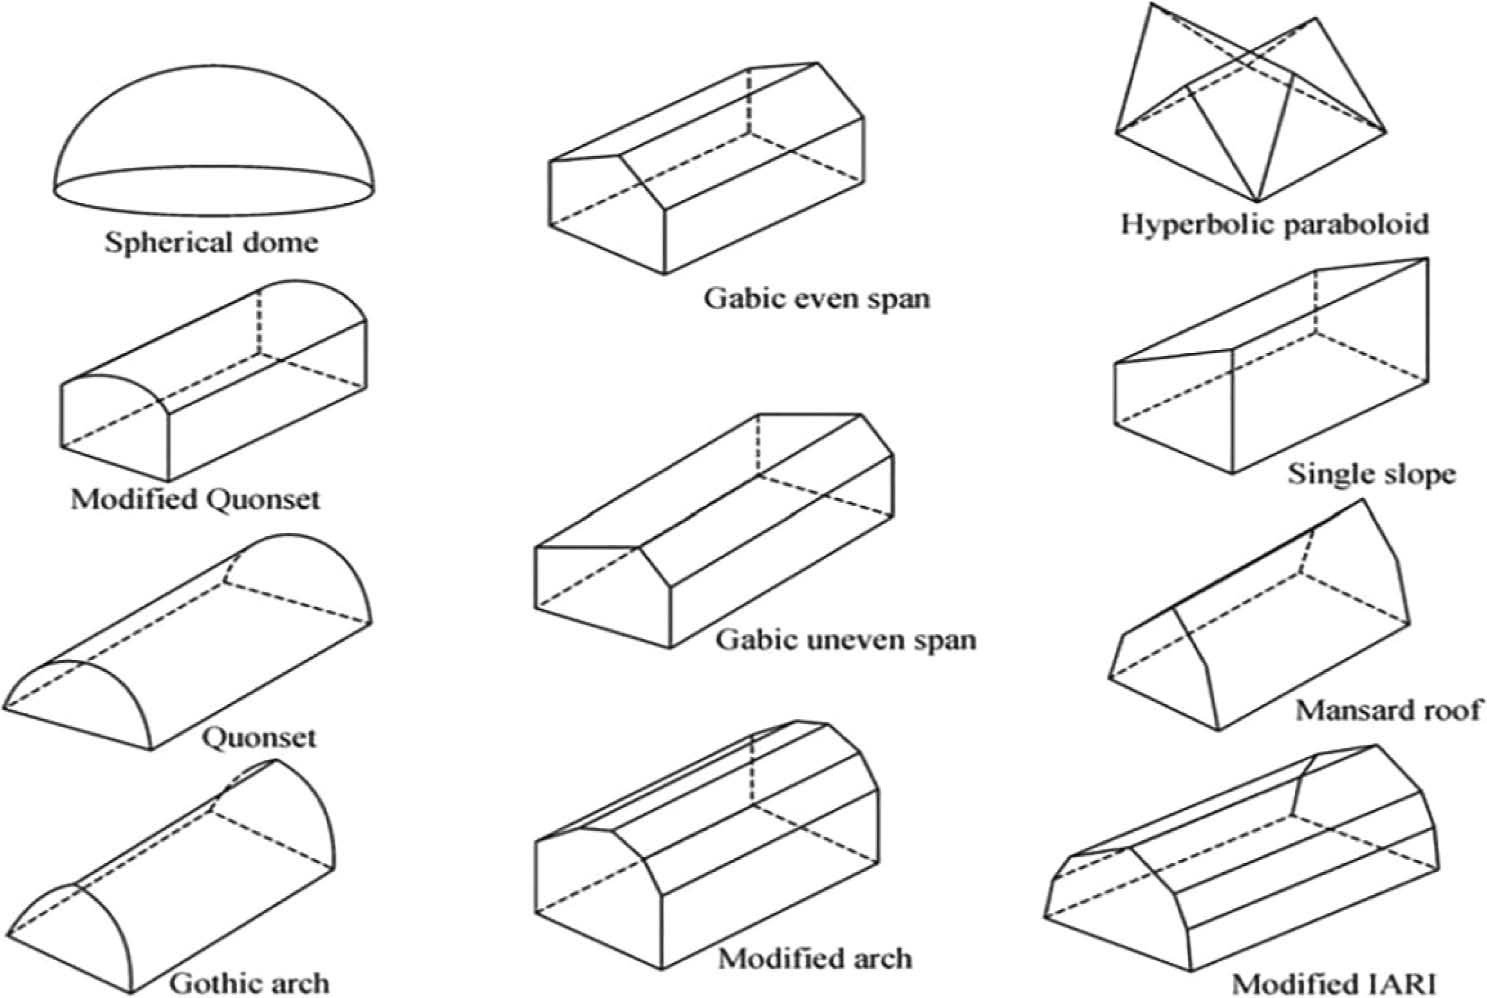
The efficient management of energy and water consumption is a key factor for sustainable greenhouse systems [6]. Other factors including clean energy sources, climate parameters, optimized irrigation systems, and pest control, all contribute to their success. Controlling the climate conditions including humidity, solar radiation, temperature and \(CO_2\) levels is also essential for the crop growth [7]. In Kuwait’s extreme weather conditions, heating/cooling systems are necessary to moderate greenhouse environments. Combined heating/cooling with natural ventilation using fuzzy-logic control systems offers an energy-efficient solution. Desiccant absorption cooling systems, rather than heat pump systems, may be more effective and energy-saving for greenhouse air ventilation in Kuwait. Sustainable greenhouse systems require thoughtful consideration of energy and water consumption, climate parameters, and efficient ventilation methods. Various architectural designs for greenhouses provide a transparent environment to receive sunlight while maintaining an interior with moderated temperature and humidity for the growth and cultivation of plants. The morphology of greenhouses is designed to allow permissible sunlight into the greenhouse and hold radiative heat. The morphology of the currently used greenhouses are depicted in Figure 1.
Greenhouses provide the optimal conditions for the growth of plants by optimizing the temperature control and the sunlight exposure. Thus, they play a vigorous role in the year-round plant production. This includes basically the commercial crops, as well as the delicate plants in luxury and botanical gardens. In addition to that, greenhouses also provide the favourable growth conditions as they optimize the temperature control and the exposure to sunlight. Similar to the greenhouse effect, greenhouse gases trap solar radiation too. In this regard, it is vital to control humidity, \(CO_2\) levels, temperature and water use. Some other factors in the greenhouse include solar irradiation, lighting, ventilation, heating/cooling, and irrigation. Fuzzy logic systems assist in regulating these factors into optimal conditions [8]. Greenhouse design and maintaining optimal environmental conditions are challenging, especially in desert-like Kuwait. The HVAC system is crucial for safe greenhouse operation. In cold climates, airtightness and closed environments protect plant growth. In warm climates, open or semi-open greenhouses prevent overheating. To regulate the temperatures inside greenhouses and thus ensure safe conditions for the greenhouse materials, techniques including near-infrared reflectors (NIR) are implemented [9,10].
Viljoen and Bohn provided design principles for self-sufficient cultivation in greenhouses in both a rural and an urban environment. They propose planting vegetable and crop plants in aquaculture-hydroponic systems and suspended hydroponics, respectively [11]. ElSoudani designed a dwelling building combined with a greenhouse structure. In winter, the greenhouse works to heat the residence, and in summer, it partially cools it [12]. In short, combining buildings with greenhouses improves the effectiveness of HVAC systems, reduces electricity use, and allows plant production to be sustainable. Open or partially open greenhouses in extreme environments such as Kuwait suffer from issues relating to water scarcity and transmission of pesticides to the outdoors.
Gorgolewski et al. [13] and Somerville et al. [14] addressed the barriers to greenhouse growing and recommended protective methods, mainly in urban setups, before they also proposed remedying aquaponics shortcomings or using integrated designs. Bavel et al. [15], on the other hand, categorized greenhouses as either temperate, tropical, or oasis. They recommended 80% relative humidity while temperatures of between 18 to 24°C are deemed favourable for plant growth. A test setpoint temperature of 24°C to various hot climatic conditions was taken. The greenhouse cooling system is regarded as mandatory with the need to maintain and control the temperature levels properly when in hot desert-type climatic conditions; effective cooling methods from systems utilizing liquid desiccant and being powered by solar energy, where a phase change material is implemented. Liquid desiccant cooling systems can be used in dwellings and greenhouses. Evaporative cooling systems, with humidifying and air fans, have been widely used in commercial greenhouses in hot/arid climates. However, liquid desiccant systems have significant liquid and energy demands and are impractical for large-scale greenhouse applications [16]-[21].
The Photovoltaic (PV) cells convert sunlight to electricity and are generally fabricated by monocrystalline silicon, polycrystalline silicon, or thin film technology. Among the three, monocrystalline cells are the most efficient and durable, though thin-film cells are relatively cheap. Some studies have been carried out on assessing applications of PV cells in greenhouses, but they do not include energy yield comparisons. This research paper is aimed at evaluating energy savings in a 70% coverage of the greenhouse roof with PV panels in Kuwait, Australia, and India. It explores cooling techniques for optimal performance of the PV under hot climates. The current paper is designed to fill the gap in systematic investigation linked to energy savings in designing a greenhouse with photovoltaic panels and their interaction with climate conditions. It presents an economically viable greenhouse design methodology for converting solar irradiation into electricity. The challenge is in coming up with a sustainable greenhouse with PV panels that can significantly reduce the heating and cooling loads of the crops in hot, arid climates for an improvement in agricultural productivity [22]-[24]. The paper contents may be summarized as follows: climate analysis (Section II); the method to integrate solar energy into the design of greenhouses (Section III); results and analysis of how much energy has been saved (Section IV); discussion and future work (Section V).
The climate conditions in the countries of Kuwait, Australia, and India are explored in order to study the climate impacts on utilizing solar PV panels for a sustainable greenhouse model. The three countries are known for their hot-subtropical or hot-tropical climate conditions, yet with different levels of humidity and precipitation. A PV potential and global solar irradiation of the studied countries is presented in Figure 2.
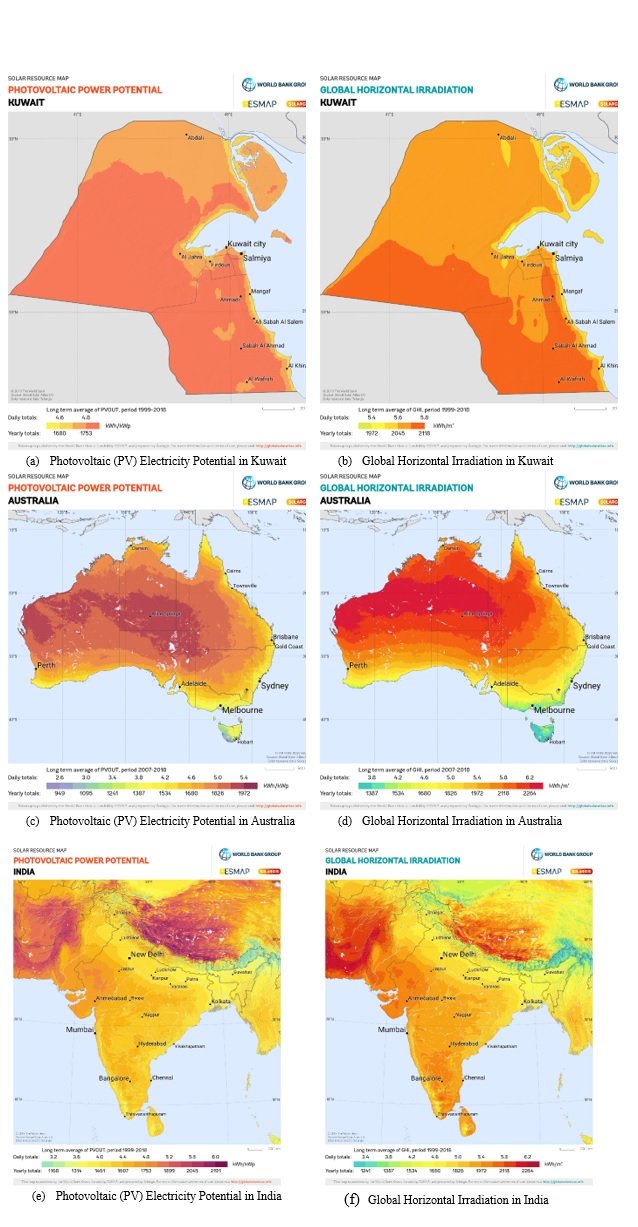
The weather of Kuwait is considered a subtropical desert climate according to the Köppen climate classification [2]. Sedaghat et al. have addressed the use of passive techniques, such as solar window films, in the context of climate change in Kuwait ‘[26], [27]’. As observed in Figure 3, scorching weather conditions and scarce natural freshwater resources are the two most important factors for accelerating the development of renewable energy systems, particularly solar energy, in Kuwait ‘[5]’. Solar energy is abundant in Kuwait (see Figures 2 and 3), with sunny and long days throughout the year. Based on weather data from the Kuwait International Airport in Mubarak Al Kabeer city in Kuwait, the average monthly irradiation is estimated to be 170.4 kWh/m². However, this value is reduced to 61.3 kWh/m² during colder months from January to March and October to December (see Figure 3), when lower values of around 120 kWh/m² are expected [6].
The Kuwaiti government has hence set a target whereby 15% of its energy generation must come from renewable sources, with the projected tripling of energy demands within the country by the year 2030 [28]. Environmental challenges that will be faced include a rise in ambient temperatures, increasing \(CO_2\) emissions, limited agricultural expansion, and the abounding availability of solar energy resources in Kuwait. In Australia, it has warm and wet summers with temperature ranging from 22 to 32°C and cold and dry winters with temperatures from 9 to 23°C. The average monthly global radiation in Rockhampton ranges from 110 to 215 kWh/m² ‘[29]’. On the other hand, Kodaikanal, India, in Tamil Nadu, has a tropical climate with solar radiation levels at 140–160 kWh/m² and an average temperature of 15°C throughout the year. More so, the ground temperature at Kodaikanal is always higher than the air temperature by a margin of about 20°C in some cases. Relative humidity ranges from 70% to 80% all year round in Kodaikanal [5]. These climate conditions and solar resources are critical considerations in sustainable greenhouse systems design and implementation for Kuwait, Australia, and India.

This study shall be based on the Gabic even span greenhouse design measuring 20m in length, 10.2m in width, and 7.5m in height includes 5m wall heights. The building material of the greenhouse is designed with inclusions of side walls (5m × 5m) fitted with transparent window materials and roof windows (5m × 2.5m) and shaded areas measuring 20m × 3m on the north and south faces for the installation of 60 PV panels each. The SketchUp 3D model is imported into TRNSYS software for energy analysis. Approximately 69% of the roof area, around 120 m², is allocated for the installation of PV panels so that it can shade and also protect the people from harmful radiation under the roof in extreme weather conditions in Kuwait. The transparent windows and roof windows allow adequate solar radiance for plant growth. The research work is carried out with solar PV panels while each panel has 0.89 m² total surface area, therefore making a total of 120 on the roof of the greenhouse. Weather information for Kuwait is taken from Kuwait International Airport, for Australia from Rockhampton International Airport, and India from Kodaikanal. The frame structure of the greenhouse is built out of steel, with transparent windows and a front door selected from the window library available in the software TRNBuild [30], [31].
The Type 194 model is developed on the well-established five-parameter equivalent circuit model, initially described by Duffie and Beckman in 1991 [7]. This circuit is developed following the calculation process documented by DeSoto et al. in the year 2005 [8]. The PV model defines the current-voltage relationship based on five parameters, which are functions of the manufacturer’s rating information to incorporate variation with varying environmental factors. The base equation for the current-voltage relation within the PV circuit is written as ‘[9]’: \[I=I_L-I_o \left[\,e^{\frac{V+IR_s}{a}}-1\right]\,-\frac{V+IR_s}{R_{sh}}, \label{Eq:1} \tag{1}\] where, \[a=\frac{N_sn_IkT_s}{q}. \label{Eq:2} \tag{2}\] To calculate the voltage and current, as well as the power that is delivered to the load, the values of five parameters must be available. Those are light current \((I_L)\), diode reverse saturation current \((I_o)\), the modified ideality factor (a) which is defined in (1) (2), as well as the series resistance and shunt resistances \((R_s)\) and \((R_sh)\) respectively. The incidence angle \((\theta)\) stands for the angle of strike of the sunlight on the PV device surface. It is vital in finding out the amount of radiation that is intercepted by the device. The incidence angle modifier, designated as \(K_{\tau\alpha} (\theta)\), is used to characterize the outcoming impact of reflection and absorption concerning the incidence angle. This modifier represents the ratio of radiation absorbed by the cell at a given incidence angle \(\theta\) to the radiation absorbed by the cell under normal incidence. To calculate the incidence angle modifier for one glass-air interface, we employ Eqs. (3) and (4), which are based on Snell’s and Bougher’s laws as reported in Duffie and Beckman’s work (1991). The angle of refraction \((\theta_r)\) is calculated by using Snell’s law [7]: \[\theta_r=\sin^{-1}{(n \sin{\theta})} , \label{Eq:3} \tag{3}\] where \(n\) stands for the effective index of refraction of the cell cover.
The transmittance of the cover system, which incorporates both reflective losses at the interface and the absorption withing the glazing, is calculated through the following approximation as [7]: \[\tau(\theta)=e^{(-KL/\cos\theta_r)} \left[1-\frac{1}{2}\left(\frac{\sin^2(\theta_r-\theta)}{\sin^2(\theta_r+\theta)}+\frac{\tan^2(\theta_r-\theta)}{\tan^2(\theta_r+\theta)}\right)\right], \label{Eq:4} \tag{4}\] where \(K\) represents the glazing extinction coefficient and \(L\) is the glazing thickness. The incidence angle modifier \((K_{\tau\alpha})\) is calculated from Eq. (4) by evaluating incidence angles \(0^\circ\) and \(\theta\). The ratio of these two transmittances delivers the incidence angle modifier as [7]: \[K_{\tau\alpha}=\frac{\tau(\theta)}{\tau(0)}. \label{Eq:5} \tag{5}\]
The spectral content of irradiance is amended through the selective absorption by atmospheric species. This will change the spectral distribution of the radiation incident on the PV panel. Thus, and in order to account for air mass effects, an empirical relation following is utilized [4]: \[\frac{M}{M_{ref}}=\sum_{0}^{4}a_i(AM)^{i}, \label{Eq:6} \tag{6}\] where \[AM=\frac{1}{\cos(\theta_z)+0.5057(96.080-\theta_z)^{-1.634}}. \label{Eq:7} \tag{7}\]
The coefficients in Eq. (6) are given by [9]: \[[a_0\quad a_1\quad a_2 \quad a_3\quad a_4] =[0.918093 \quad 0.086257 \quad-0.024459 \quad 0.002816 \quad -0.000126].\]
The air infiltration into the greenhouse was modeled based on wind speed data for the studied climate using a linear function as follows: \[\text{Infiltration}=0.07V+0.4\frac{l}{h}. \label{Eq:8} \tag{8}\]
The value of air infiltration usually varies between \(0.5\) to \(3~l/h\), with a higher range indicating a less airtight building. Therefore, a less airtight greenhouse is considered better for lowering the zonal temperature of the greenhouse. The sensible heat gains come from lighting, people, and electrical equipment, which are defined in the TRNSYS software. A total of 12 LED lights , each consuming 200 W of power, were used for the greenhouse according to the daily schedule [10]. The lights remain on throughout the day until midnight and are turned off from 0:00 am to 6:00 am. The radiative heat gain in TRNSYS is obtained as follows:
\[\text{Lighting heat gain}=8640~ \mbox{Daily} \left(\frac{kJ}{h}\right). \label{Eq:9} \tag{9}\]
The sensible heat gain from 5 people working moderately (100 W each) daily is modelled as: \[\text{People heat gain}=1800~ \mbox{Daily} \left(\frac{kJ}{h}\right). \label{Eq:10} \tag{10}\]
The sensible heat gain from electrical equipment (200 W) is also modelled as: \[\text{Equipment heat gain}=3600~ \mbox{Daily} \left(\frac{kJ}{h}\right). \label{Eq:11} \tag{11}\]
For heating/cooling loads, it is assumed that the temperature of the greenhouse should remain at \(24^\circ\)C continuously throughout the year. The recommended greenhouse temperature usually falls within the range of \(18-24^\circ\)C. However, the upper limit of \(24^\circ\)C was used for all the studied climates.
Annual heating/cooling demands and PV electric production can be quantified using an energy performance index (\(EPI\)) as follows: \[EPI=\frac{\text{Annual energy demand~or~production}}{\text{Planform~area~of~greenhouse}} (kWh/m^2/\text{year}) . \label{Eq:12} \tag{12}\]
Integrating \(EPI\) values over different months of the year is done in the same manner as depicted in Eq. (12). However, in this case, these values show the monthly variation of EPI rather than the annual variation.
To examine the impacts of climate conditions on heating/cooling demands, the results for operative and air temperatures in the greenhouse are compared with the ambient and soil temperatures, and heating/cooling loads are compared with PV electricity generation in the three climates of Kuwait, Australia, and India. Additionally, two orientations for PV panels, consisting of 25.2 and 0.0 degrees, are considered for both the south (S) and north (N) roof faces. The third orientation assumes PV panels off the roofs towards the south (S) with the latitude angle of each city. The latter is considered the orientation that maximizes PV electricity generation.
In the Gulf Consortium Countries (GCC), approximately 13,000 hectares of greenhouses are in use, consuming 20-50 GJ/hectare/year or 5,556-13,890 kWh/hectare. This results in an estimated annual \(CO_2\) production ranging from 28 to 70 million tons (MT) in the GCC [32], [33]. In Kuwait, the 204 m2 greenhouse large cross-sectional area leads to temperature oscillations within a \(10^{\circ}\)C margin, which implies a suboptimal uniformity. The potential benefits of smaller greenhouse dimensions could be examined though additional research.
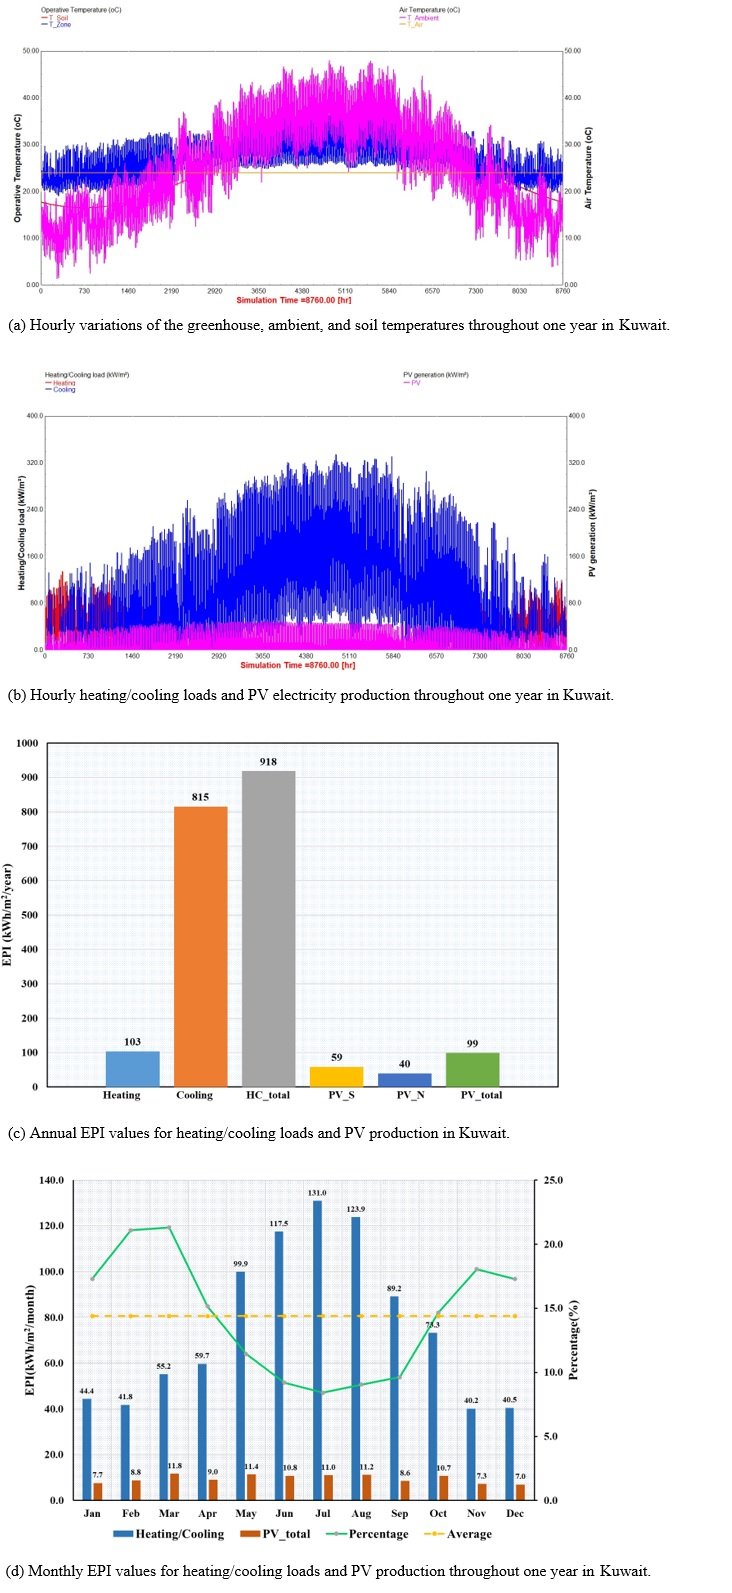
On average, the yearly generation of a single PV panel is around 40 kWh/m²/day throughout the year. Hence, the heating demands in winter increase the energy consumption to 120 kWh/m²/day, while high cooling demands during hot summer days increase the energy consumption up to 320 kWh/m²/day [33]. Alsultanny and Alharbi [34] studied the influence of meteorological factors on solar power generation using real data. They found the sunshine hours are the most important parameter on electrical power generation in Kuwait. Guryev et al. studied the middle east solar energy potential using genetic algorithm and concluded the region has high potential due to uniform solar radiation [35]. Haydaroğlu and Gümüş investigated soiling effects on efficiency of solar power generation of PV panels. The soiling is one of important factors reducing efficiency of PV panels in Kuwait and middle east [36]. Shah and Zhang highlighted the importance of solar PV panel developments in desert countries for sustainability [37]. Abd et al. investigated a hybrid solar and wind energy potentials in Iraq. They showed that the hybrid system can enhance significantly the renewable energy production [38]. Figure 4 highlights the climate of Kuwait, energy demands, and PV electricity production for the studied greenhouse in Kuwait. As observed in Figure 4c, the annual heating/cooling demands are 103 and 815 kWh/m²/year, adding up to a total heating/cooling demand of 918 kWh/m²/year. The south (S) facing 60 PV panels with a slope of 25.2 degrees generate 59 kWh/m²/year, while the north (N) facing 60 PV panels merely produce 40 kWh/m²/year. Overall, the PV panels produce 20,196 kWh/year; this contribution is nearly 11.6% of the annual energy demands of the greenhouse. As shown in Figure 4d, the average monthly PV production is 14.4% with a PV slope of 29.3 degrees. With the PV electricity percentage of 14.4%, the annual PV electricity production will be 26,967 kWh/year and between 4-7 MT \(CO_2\) can be reduced annually in Kuwait.
Australia has approximately 1,300 hectares of greenhouses in operation [11]. These greenhouses use energy in the range of 5,556-13,890 kWh per hectare. At these energy consumption rates, the estimated \(CO_2\) production in these greenhouses ranges from 2.8 to 7 MT in Australia. Figure 5 below shows weather conditions, energy consumption, and PV generation for the studied greenhouse in Rockhampton, Australia. As observed in Figure 5c, the total annual heating/cooling demands for the greenhouse in Rockhampton of Australia is 726,918 kWh/m2/year whilst the total of 100 kWh/m2/year is produced by the PV panels. The PV production is nearly identical to Kuwait, with more south (S) facing panels production. The annual production of 120 PV panels in Rockhampton, Australia, is 20,400 kWh/year, equivalent to 13.9% of the annual energy demands of the greenhouse. The average monthly PV electricity generation is 16.7% for the slope of 23.4 (the latitude angle of Rockhampton) as shown in Figure 5d. This indicates that the contribution of PV panels to energy savings in Australia will be greater when compared to Kuwait, as the energy demands of the greenhouse are less. With the latitude angle south (S) facing PV panels, the annual electricity production will be 24,733 kWh/year, which is slightly lesser than the counterpart value in Kuwait. To conclude, the \(CO_2\) production from these greenhouses can be reduced in Australia from 0.5 to 1.17 MT.

In India, there is an estimate of 110,000 hectares of greenhouses in operation [12]. Seeing that there is about 20-50 GJ energy consumption rate per hectare per year of these greenhouses (equivalent to 5,556-13,890 kWh per hectare), the produced amount of \(CO_2\) from these greenhouses in India ranges between 238 to 594 MT. Figure 6 illustrates characteristics of weather condition, energy consumption, and PV production in Kodaikanal, India. The annual heating/cooling demand (EPI value) is 519 kWh/m²/year, as depicted in Figure 6, for Kodaikanal in India. Like Kuwait and Australia, 120 PV panels can produce the same annual electricity of 96 kWh/m²/year. Overall, the PV panels in Kodaikanal, India, can produce 19,584 kWh/year, which is 18.5% of the annual energy demands of the greenhouse. The same figure shows nearly uniform PV electricity production throughout the year with an average value of 20.1% using PV slopes of 10.2 degrees at Kodaikanal. With PV panels at this angle, the annual PV electricity production may reach 21,281 kWh/year and between 48 to 199 MT \(CO_2\) will be reduced annually in India.

A one-way ANOVA test was conducted in this study in order to examine two null hypotheses. The first hypothesis evaluates whether the climate conditions have direct effects on PV electricity production. The second hypothesis investigates whether the slope angles of the PV panels play a significant role in the performance of the studied PV panels. Table 1 presents the monthly variation of electricity production of PV panels in the studied climates at various slope angles (in degrees). The one-way ANOVA test was conducted using the statistical analysis toolbox of Excel, and the results are shown in Table 2. The aim of the test was to evaluate the null hypothesis that there are no differences between the means of three climate locations: Kuwait, Australia, and India, when PV panels were installed at the altitude angles specific to each location. It was noticed that the critical f-value of 3.28 was bigger than the observed f-statistics value of \(2.48\), which shows that the null hypothesis is accepted. Additionally, and since the \(\alpha\)-value of 0.05 was found to be smaller than the p-value of 0.099, this makes the values of the null hypothesis more trust-worthy. These findings are in good agreement with the results from earlier observations.
| Kuwait | Rockhampton, Australia | Kodaikanal, India | |
| Month/Angle | 0 25 29.3 | 0 23.4 25.2 | 0 10.2 25.2 |
| Jan | 5.5 5.1 7.7 | 10.5 9.6 9.8 | 9.0 10.0 8.3 |
| Feb | 6.9 6.3 8.8 | 8.9 8.7 8.3 | 8.9 9.4 8.2 |
| Mar | 10.2 9.3 11.8 | 9.7 10.2 9.0 | 10.2 10.4 9.5 |
| Apr | 9.0 8.4 9.0 | 8.1 9.4 7.5 | 9.6 9.4 8.9 |
| May | 12.3 11.3 11.4 | 7.2 9.4 6.6 | 9.2 8.8 8.5 |
| Jun | 12.3 11.3 10.8 | 6.2 8.5 5.7 | 8.5 8.0 7.8 |
| Jul | 12.2 11.2 11.0 | 6.9 9.3 6.4 | 8.3 7.8 7.7 |
| Aug | 11.5 10.6 11.2 | 8.4 10.4 7.7 | 8.2 8.0 7.6 |
| Sep | 8.1 7.5 8.6 | 9.9 11.0 9.1 | 8.7 8.8 8.2 |
| Oct | 8.6 7.9 10.7 | 10.9 10.9 10.1 | 8.2 8.5 7.7 |
| Nov | 5.5 5.1 7.3 | 11.1 10.4 10.3 | 7.1 7.6 6.6 |
| Dec | 5.0 4.7 7.0 | 10.8 9.5 10.0 | 7.5 8.2 7.0 |
| Groups | Count | Sum | Average | Variance |
|---|---|---|---|---|
| 1-5 Kuwait | 12 | 115.3517 | 9.612641 | 3.026317 |
| Australia | 12 | 117.1512 | 9.762599 | 0.646099 |
| India | 12 | 104.7938 | 8.73282 | 0.816223 |
| Source of Variation | SS | df | MS | F | P-Value | F crit |
|---|---|---|---|---|---|---|
| 1-5 Between Groups | 7.428069 | 2 | 3.714035 | 2.48229 | 0.099022 | 3.284918 |
| Within Groups | 49.375032 | 33 | 1.496213 | |||
| Total | 56.8031 | 35 | ||||
| Anova: Single Factor Kuwait | ||||||
| Summary | ||||||
| 1-5 Groups | Count | Sum | Average | Variance | ||
| 1-5 0 degree | 12 | 107.1 | 8.925 | 7.774773 | ||
| 25 degree | 12 | 98.7 | 8.225 | 6.443864 | ||
| 29.3 degree | 12 | 115.3 | 9.608333 | 2.991742 | ||
| Anova | ||||||
| Source of Variation | SS | df | MS | F | P-Value | F crit |
| 1-5 Between Groups | 11.48222 | 2 | 5.741111 | 1.000753 | 0.378485 | 3.284918 |
| Within Groups | 189.3142 | 33 | 5.736793 | |||
| Total | 200.7964 | 35 | ||||
| Anova: Single Factor Rockhampton, Australia | ||||||
| Summary | ||||||
| 1-5 Groups | Count | Sum | Average | Variance | ||
| 1-5 0 degree | 12 | 108.6 | 9.05 | 2.859091 | ||
| 25 degree | 12 | 117.3 | 9.775 | 0.6475 | ||
| 29.3 degree | 12 | 100.5 | 8.375 | 2.518409 | ||
| Anova | ||||||
| Source of Variation | SS | df | MS | F | P-Value | F crit |
| 1-5 Between Groups | 11.765 | 2 | 5.8825 | 2.929046 | 0.067458 | 3.284918 |
| Within Groups | 66.275 | 33 | 2.008333 | |||
| Total | 78.04 | 35 | ||||
| Anova: Single Factor Kodaikanal, India | ||||||
| Summary | ||||||
| 1-5 Groups | Count | Sum | Average | Variance | ||
| 1-5 0 degree | 12 | 103.4 | 8.616667 | 0.732424 | ||
| 25 degree | 12 | 104.9 | 8.741667 | 0.80447 | ||
| 29.3 degree | 12 | 96 | 8 | 0.62 | ||
| Anova | ||||||
| Source of Variation | SS | df | MS | F | P-Value | F crit |
| 1-5 Between Groups | 3.783889 | 2 | 1.891944 | 2.631485 | 0.087023 | 3.284918 |
| Within Groups | 23.72583 | 33 | 0.718965 | |||
| Total | 27.50972 | 35 | ||||
Next, the effects of different PV slope angles are investigated for Kuwait, Australia, and India, and the ANOVA test results are shown in Table 3. As illustrated, the ANOVA test results indicate that the three studied PV angles for Kuwait, Australia, and India have statistically rejected the alternative hypothesis, suggesting that the PV angles have no significant effects on PV power production. Therefore, from a statistical point of view, the studied PV angles show no significant differences in power production.
The energy performance of a greenhouse was investigated in three different climates (Kuwait, Australia, and India) using roof-installed PV panels. Weather data from Mubarak Al Kabeer (Kuwait), Rockhampton (Australia), and Kodaikanal (India) were carefully examined, and the greenhouse’s energy performance was analysed using TRNSYS software. About 70% of the roof was covered with PV panels to provide shade and generate clean solar energy. This additional shading area helps protect plants from excessive radiation, particularly during lengthy sunny periods in Kuwait (which can last up to 11 hours). However, in milder climates, some studies suggest that only 25% roof shading is necessary. The focus of this study was to assess the greenhouse’s energy performance with 120 PV panels installed on or off the roof. The study concludes that:
The PV panels produced an annual electricity production (EPI) of approximately 100 \(kWh/m^{2}/year\) across all three climates.
South-facing PV panels showed better performance, especially at latitude angles of 29.3, 23.4, and 10.2 degrees for the three studied cities of Kuwait, Australia, and India, respectively.
With 120 PV panels, the annual PV electricity yield for Kuwait, Australia, and India was 26,967, 24,733, and 21,281 kWh/year, respectively.
Using PV panels, energy savings of 14.4%, 16.7%, and 20.1% were achieved in Kuwait, Australia, and India, respectively.
Using PV panels, the annual \(CO_2\) production from glass greenhouses can be reduced between 4-7 MT in Kuwait, 0.5-1.17 MT in Australia, and 48-199 MT in India.
ANOVA tests indicated that the location and PV angles have no significant impact on PV electricity production.
Additional research is necessary to enhance the size of the greenhouse and minimize zonal temperature variations. The design of the greenhouse roof may also need modification to enable the installation of PV panels at the desired latitude angles. Moreover, further investigation is essential to select and simulate the optimal materials to be used for the greenhouse structure.
The data that support the findings of this study are available from the corresponding author upon reasonable request.
The authors acknowledge the students from Australian University of Kuwait: Noor Abdullah, Abdulwahab Alali, Sarah Albathani, Abdullah Alaftann and Betsy John for their engagements in similar project and the insight gained during their study.
The authors have no conflicts of interest to declare that are relevant to the content of this article.