
As urbanization continues to accelerate, cities are facing more and more challenges, such as traffic congestion, environmental pollution, waste of resources and other problems that are becoming more and more prominent. In order to solve these problems, the concept of smart city has gradually emerged, aiming to improve the management and operation efficiency of cities through scientific and technological means, and create a more livable urban space. In the construction of smart city, green and sustainable development is one of the important concepts, how to realize sustainable green space layout in urban development has become an urgent problem [1]-[3].
Green space is an important part of the smart city, and also an important place for urban residents’ leisure and health. The construction of green space such as urban green space, parks, lakes, etc. is crucial to improve the quality of urban environment and enhance the quality of life of residents. Smart cities advocate the planning and construction of green spaces, and create livable urban green environments by means of vegetation cover, water management and ecological restoration. At the same time, the use of intelligent technology to realize the green space of intelligent irrigation, light control, to enhance the ecological benefits of green space and sustainable development level. With the continuous progress of science and technology, artificial intelligence, as a powerful technical means, has gradually entered people’s vision. Artificial intelligence is applied in all walks of life, bringing great convenience and benefits to human beings, and in the layout and design of urban green space, artificial intelligence also provides new ideas for the construction of smart cities [4]-[7].
Literature [8] states that smart cities are able to cope with various urban problems and provide a comfortable environment for human beings. The concept of “cy-phy” cities was introduced with the aim of considering sustainability and environmental, social and governance aspects of urban operations. Literature [9] introduced AI algorithms into the spatial environment design of green landscape to construct a visual system with both online and offline operation forms. The system not only can fully utilize the idle time of the cable drain reader, but also will not affect the next stage of operation, possessing strong practicality. Literature [10] aims to design a roadway that not only meets the needs of citizens’ activities but also accommodates vehicles in order to comply with the basic principles of green economy. It also adopts GIS technology and GA to optimize the urban public street space, which bridges the gap between urban development and public health, and has a certain reference value for sustainable urban spatial planning and green economic development. Literature [11] describes that generative adversarial networks can generate new images that meet several domain-specific guidelines. A number of experiments were carried out, including “data preparation and collection” and “optimization training”, and many experimental results were obtained, including “GANs have the ability to mine design rules like humans” and “GAN-driven data augmentation methods can improve the generation ability of algorithms”. Literature [12] shows the importance of the green index in urban planning, showing through experiments that there are other spaces for green coverage in places with a low green index, and emphasizes the importance of reserving space for green in urban planning as an important strategy for cities to achieve overall well-being. Literature [13] outlines the formation, concept, impact and vision of smart cities, which aims to analyze smart transportation initiatives and explores the role of ICT in smart transportation actions and quality of life of citizens, among others. Literature [14] specifies that urban green space is an important part of urban infrastructure, introduces a classification method of urban green space based on function combination, and investigates the differences in the audience’s demand for five types of urban green space, among other things, and concludes that there is a large difference in the public’s bias towards different types of urban green space, and that there is an increase in the number of individual types of green space. Literature [15] emphasized the importance of urban green space for residents’ life. Using statistical tests and kernel density estimation, a correlation analysis of the spatial pattern of human activities in various parks was carried out with the aim of reminding urban policy makers of the value of providing green space opportunities for citizens. Literature [16] reveals that with the rapid growth of urban population, appropriate development of urban space can effectively alleviate urban pressure, however, the most important thing that cannot be neglected in the process of building a smart city is to ensure ecological sustainability. Literature [17] compares the experiences of urban green space planning and management in several European cities, aiming to understand the achievements and failures. The results show that although green space planning varies from place to place, the results in planning and management cannot be separated from factors such as the level of participation in urban management and citizen engagement.
This paper proposes a green spatial layout design model for urban environment based on the Pix2Pix algorithm, in which the optimal spatial layout design scheme in urban environmental planning can be obtained with the assistance of the model to promote the green construction of the smart city. Taking Unity3D engine and Python language as the construction platform, the generator and discriminator in the network structure of Pix2Pix model are utilized to read the floor plan of the target environment area. Run the model after inputting the parameters related to the green space layout of urban environment design, and adjust the green space layout design scheme through the design simulation diagram output from the model to get the optimal design scheme. In this study, an urban residential area is selected as a case study object, and the model is used to intelligently assist in the design of the green space layout of the neighborhood after fully considering the climatic conditions of the area. By analyzing the changes in energy consumption and residents’ satisfaction after the implementation of the green space layout program, the effect of the green space layout design program with the assistance of artificial intelligence is explored.
In this study, Pix2Pix is chosen as the key algorithm for generating green space layout in urban environment design, and based on the characteristics of this algorithm, we reasonably plan the generation design experiment and formulate the experimental ideas.
The Pix2Pix model [18] used in the experiments of this paper belongs to supervised learning, which is a kind of conditional generative adversarial network (cGAN for short). cGAN [19] is a variant of generative adversarial network (GAN for short). To understand how Pix2Pix works, it is first necessary to understand the principles of its source, GAN.
GAN is a young deep learning framework with a simple but powerful idea, similar to a “zero-sum game”, i.e. rewarding the “right” while penalizing the “wrong”. GAN mainly contains a generator and a discriminator which learns the mapping relation \(G:z\to y\) from the random noise vector \(z\) to the output image \(y\).
The emergence of GAN, though significant, is further enhanced by the emergence of Conditional Generative Adversarial Networks (cGAN), whose inputs are random noise vectors and outputs are random data obeying the distribution of the training dataset at the time of application. Conditional Generative Adversarial Network, as the name suggests, generates corresponding images based on given conditions, and it learns the mapping relationship \(G:\left\{x,z\right\}\to y\) from the read image \(x\) and random noise vector \(z\) to the output image \(y\).
In addition to generating images with text as a given condition, cGAN can also be used for image processing tasks, since such tasks can be often viewed as “image as a condition” problems, or as image translation/conversion problems. The Pix2Pix model used in the experiments of this paper is a model proposed to solve this kind of problem.
The Pix2Pix model network structure consists of a generator \(G\left(Generator\right)\) and a discriminator \(D\left(Discriminator\right)\), and its objective function is based on the objective function of cGAN. Firstly, we prepare a dataset, which contains the input image \(x\) and the transformed image \(y\). Input image \(x\) is used as a condition, and both generator \(G\) and discriminator \(D\) have to read this image, where the input to generator \(G\) is not only image \(x\) but also a random noise \(z\). Generator learns and outputs the image \(G\left\{x,z\right\}\), and discriminator \(D\) is responsible for discriminating between image \(\left\{x,G\left\{x,z\right\}\right\}\) and image \(\left\{x,y\right\}\), and outputs a value from 0 to 1 (scalar). The closer the output value is to 1, the more the discriminator considers \(\left\{x,G\left\{x,z\right\}\right\}\) to be true, and the closer the output value is to 0, the more the discriminator considers \(\left\{x,G\left\{x,z\right\}\right\}\) to be false, so the labeled picture \(y\) as the judgment benchmark is also called groundtruth. After the discriminator \(D\) outputs the value, the generator \(G\) performs an iteration and outputs a new picture in an attempt to fool the discriminator \(D\) and obtain a value closer to 1. The process is repeated over and over again to obtain a more realistic output picture.
The objective function of cGAN can be expressed as in Eq. (1), where, through constant iterations, the generator \(G\) tries to minimize the objective function, while the discriminator \(D\) tries to maximize the objective function: \[\label{GrindEQ__1_} \begin{array}{rcl} {\mathrm{{\mathcal L}}{}_{cGAN} \left(G,D\right)} {=} {\mathrm{{\mathbb E}}_{x,y} \left[\log D\left(x,y\right)\right]} {+\mathrm{{\mathbb E}}_{x,z} \left[\log \left(1-D\left(x,G\left(x,z\right)\right)\right)\right]}. \end{array} \tag{1}\]
In the existing cGAN related research, it has been found that it is beneficial to mix GAN with the traditional loss function, although the role of the discriminator remains the same, but this can make the task of generator \(G\) “not only to deceive the discriminator, but also to ensure that the output is closer to the real situation”, so this paper adds L1Loss to Pix2Pix on the basis of cGAN, and uses \(\lambda\) to control whether L1Loss participates, so the final objective function of Pix2Pix is as follows: \[\label{GrindEQ__2_} G^{*} =\arg {\mathop{\min }\limits_{G}} {\mathop{\max }\limits_{D}} \mathrm{{\mathcal L}}_{cGAN} \left(G,D\right)+\lambda \mathrm{{\mathcal L}}_{L1} \left(G\right) . \tag{2}\]
The Pix2Pix model has broadened the scope of cGAN applications, and its own merits have spawned many interdisciplinary studies. First of all, many cGAN models today are tailored to specific tasks and have weak generalization ability, whereas Pix2Pix is different in that it is not developed specifically for a certain type of task, and when using it, one only needs to change the training dataset according to the task objectives.
The simulation in this paper uses the Unity3D engine [20], Unity3D a cross-platform real-time engine developed by Unity Technologies.
In recent years, this engine has gradually become the 3D engine of choice for many teams, and the main reasons for choosing Unity3D engine and its main advantages in this paper are as follows.
(1) Customizable IDE environment, Unity3D adopts the design idea of “All in one”, integrating all editors in one.
(2) Good visualization effect, Unity3D engine can not only run the program at any time, but also adjust the parameters instantly while the program is running to detect the editing results of the green space layout design of urban buildings.
(3) Rich auxiliary resources, Unity was launched on the Asset Store in 2010, and now there are more than a million developers have thousands of free resources. Users can get a lot of problem solving methods from it, which is not available in most other engines at present.
The program is programmed in C#, a general-purpose multi-paradigm, object-oriented (class-based) and component-oriented programming language.The Unity engine provides a scripting environment with Mono, which currently supports languages such as C#, Visual Basic, JavaScript, Python, Boo, etc. The reason for using C# as the programming language is that C# is the mainstream language of NET/Mono, and it is an excellent and mature language compared with other languages. The reason for using C# as the programming language is because C# is the mainstream language of NET/Mono, which is an excellent and mature language compared to other languages, strongly supported by Microsoft, and the threshold of learning is relatively low.
This study is based on the pixtopix algorithm, using python language [21], on pycharm environment to build the green space layout generation design model in the urban environment design of this paper.
(1) In the dataset file directory to create a city building green space layout design input map and label map of the two folders, and then put into the training set and test set data assigned in advance. It is worth noting that it is necessary to ensure that the number of input maps and labeled maps as well as the file names in the training set and test set are the same. Finally, run the file combine_A_and_B.py to combine the input maps and labeled maps together to facilitate the next step of inputting them into the model for training.
(2) Before the model starts training, it is necessary to set the basic parameters of the green space layout design model and the training parameters, in which the basic parameters of the model include specifying the storage path of the training images, whether or not to train on multiple GPUs, the parameters of the network structure of the generator and the discriminator, and the parameters of the dataset, and so on. Among them, we mainly need to set the number of data loading threads and the size of batchsize. Model training parameters include data training visualization parameters, network saving and loading parameters, and training parameters, of which the most important is the need to set the size of epochs in the training parameters, the size of the learning rate, and the type of loss function of the pixtopix model.
(3) After the completion of the green space layout design model basic parameters and training parameters of the settings can run the train.py file for model training, which can be run by running the visdom package to observe the model of the loss function curve changes and the effect of the training picture generation.
(4) When the model training is over, you can observe whether the effect of the green space layout design pictures generated by the training is close to the real data, if you are not satisfied with the training results, you can continue the training by specifying the continue_train parameter on the basis of the previous training. After the end of training, you can run the test.py file to observe the effect of the training set, so as to realize the design of green space layout in the urban environment with the assistance of artificial intelligence. Before that, you can set the test parameters of the model to change the path to save the generated test set file and the number of test images.
Pixtopix’s loss function is improved from CGAN, whose loss function formula is shown below: \[\label{GrindEQ__3_} \begin{array}{rcl} {L_{cGAN} \left(G,D\right)} {=} {E_{x,y} \left[\log D\left(x,y\right)\right]} {+E_{x,z} \left[\log \left(1-D\left(x,G\left(x,z\right)\right)\right)\right]}. \end{array} \tag{3}\]
The optimization objective of the generator of the conditional GAN is to minimize the above equation, and the optimization objective of the discriminator is to maximize the above equation, and at the same time need to de-constrain the proximity of the generated image and the real image, which needs to de-minimize the distance between the two, Pix2Pix chooses the \(L_{1}\)-loss function, and the sum of the antagonistic and the \(L_{1}\)-losses results in the overall loss function given in Eq. (4): \[\label{GrindEQ__4_} G^{*} =\arg \min \max \mathrm{{\mathcal L}}_{CGAN} \left(G,D\right)+\lambda \mathrm{{\mathcal L}}_{L1} \left(G\right) . \tag{4}\]
Pix2Pix uses the Adam optimizer with values of 0.5 and 0.999 for the two momentum parameters \(\beta 1\) and \(\beta 2\), respectively.
The research object selected for this study is a high-rise residential district in Xi’an City, which has already obtained the two-star design evaluation mark for green building evaluation, but there are still big problems in the district’s plot ratio, green space rate, building density, etc., and the district’s residential buildings consume large amounts of energy, and the satisfaction level of the residents is at a relatively low level. At present, China’s evaluation of high-standard green buildings is still in the development stage, and the correlation between the control items and score items in the chapter of “Four Sections and One Environmental Protection” is not accurate enough, which results in the poor overall spatial layout of green buildings. Therefore, this study selects the environment of the district, and improves the environment of the district and the spatial layout of the building through the green layout spatial design model assisted by artificial intelligence to optimize the green environment of residential buildings. The site selected for the study is located in Guo Du Street, Chang’an District, Xi’an City, Xi’an City, adjacent to the planned Gao Yang 4th Road in the west, the planned Gao Yang 3rd Road in the east, Jian Ye 3rd Road in the south, and the planned Jian Ye 2nd Road in the north. The project’s planned construction land area is 35624.62m², with a total building area of 136542.26 m², including residential building area of 96524.35 m² above ground. The area occupied by city-grade commercial buildings and supporting public buildings is 6,642.35 m² and 2,364.52 m², respectively, with the remainder being ancillary facilities (e.g., fitness facilities, etc.) in the neighborhood buildings. The plot ratio of the project is 3.4, the green space rate is 29.65%, the building density is 20.14%, and the total number of residential households is 962. In this study, the green space layout transformation design with the assistance of artificial intelligence is carried out for the environment of the neighborhood, and the residential buildings in the neighborhood are also selected for green transformation, and the detailed information of the residential buildings is shown in Table 1. The residential buildings studied include five 13F, five 15F, two 17F, one 21F, one 30F, and one 26F residential buildings.
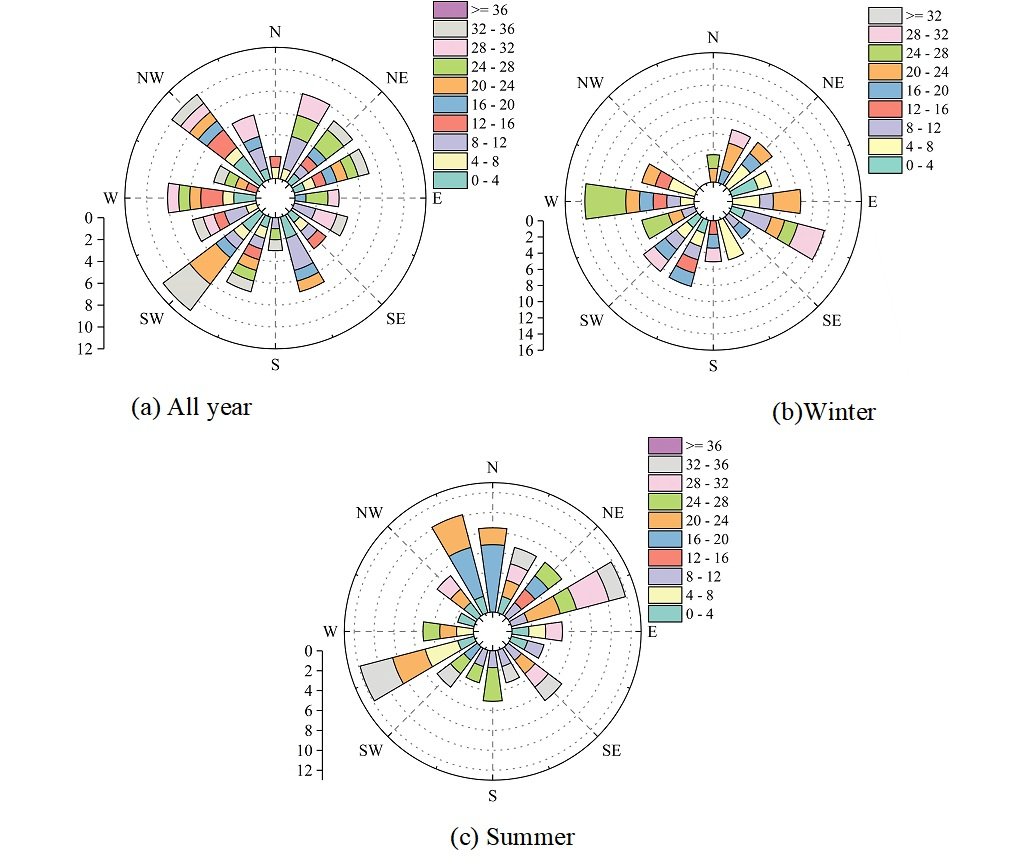
Before the green space layout design of the studied neighborhood environment, the climatic conditions of the region need to be analyzed in order to use the climatic conditions of the place to carry out a reasonable green layout design planning for the neighborhood buildings and the surrounding environment. Xi’an City is located in the southern part of the Guanzhong Plain, the climate type belongs to the warm temperate semi-humid continental monsoon climate, the thermal division for the cold B zone. In this paper, through the Ecotect software meteorological data analysis, we get the annual wind rose map of Xi’an City, where the research building object is located, as shown in Fig. 1, (a)-(c) represent the wind direction and wind speed analysis results of Xi’an City for the whole year, winter and summer, respectively, and the different colors in the map represent the level of wind speed. The highest wind speed in Xi’an city reaches 34.9 knots/hour throughout the year, and the most wind direction is SW direction throughout the year, and the frequency of the annual most wind direction is 11.11%. The most wind direction in winter is ENE direction and WSW direction, and the frequency of occurrence of this wind direction is 11.87% in both directions. In summer, the most frequent wind direction is W, and the minimum and maximum outdoor wind speeds are 0.2 m/s and 30 m/s, respectively.
| Floor number | Function | Monomer building area (\(\rm m^2 \)) | Building number | Altitude(m) | Structural form | Household number |
| A-1# | Business and office | 6384.98 | 15F/-2F | 92.36 | Shear wall | —— |
| A-2# | Supporting house | 9737.86 | 26F/-2F | 96.42 | Shear wall | 164 |
| A-3# | Housing | 5848.83 | 30F/-1F | 99.86 | Shear wall | 172 |
| A-4# | Housing | 8326.45 | 21F/-1F | 92.34 | Shear wall | 62 |
| A-5# | Housing | 4908.07 | 15F/-1F | 48.92 | Shear wall | 50 |
| A-6# | Housing | 15748.9 | 17F/-1F | 53.64 | Shear wall | 37 |
| A-7# | Housing | 7705.77 | 15F/-1F | 48.92 | Shear wall | 39 |
| A-8# | Housing | 8646.55 | 15F/-1F | 48.92 | Shear wall | 74 |
| A-9# | Housing | 13491.68 | 17F/-1F | 53.64 | Shear wall | 39 |
| A-10# | Housing | 5108.82 | 15F/-1F | 48.92 | Shear wall | 39 |
| A-11# | Housing | 15806.1 | 13F/-1F | 42.36 | Shear wall | 21 |
| A-12# | Housing | 9346.39 | 13F/-1F | 42.36 | Shear wall | 54 |
| A-13# | Housing | 8246.71 | 13F/-1F | 42.36 | Shear wall | 73 |
| A-14# | Housing | 5247.85 | 13F/-1F | 42.36 | Shear wall | 79 |
| A-15# | Housing | 7429.79 | 13F/-1F | 42.36 | Shear wall | 79 |
The results of the analysis of other major natural environmental conditions are shown in Table 2. The extreme maximum temperature and extreme minimum temperature are 40.63\(\mathrm{{}^\circ}\)C and -15.23\(\mathrm{{}^\circ}\)C respectively. The project site is located in Chang’an District, Xi’an City, where the sunshine is 1426.32 hours, the annual precipitation is about 542.36mm, and the dominant wind direction throughout the year is the northeast wind, and the annual average wind speed is 1.25-2.58m/s. China can be divided into three types of solar radiation zones, and Xi’an belongs to the general solar resource zone, with an annual total radiation of 4752.62 MJ/m²·a, and a total annual average daily irradiation of 13.02 MJ/ m². The average daily sunshine duration reaches 4.5-7.5h throughout the year, and the range of solar energy guarantee can reach 55%-83% throughout the year, which provides favorable conditions for the use of natural resources in the design of green space layout. The monthly average total daily irradiation is higher in June to August, and the average daily sunshine duration can reach about 7.5h, and about 4.5h in winter.
| Serial number | species | Numerical value |
| 1 | Annual average temperature | 14.23\(\mathtt{{}^\circ\!{C}}\) |
| 2 | Annual average rainfall | 542.36mm |
| 3 | Average temperature for the coldest month | -1.32\(\mathtt{{}^\circ\!{C}}\) |
| 4 | Average temperature of the hottest month | 28.63\(\mathtt{{}^\circ\!{C}}\) |
| 5 | Minimum extreme temperature | -15.23\(\mathtt{{}^\circ\!{C}}\) |
| 6 | Maximum extreme temperature | 40.63\(\mathtt{{}^\circ\!{C}}\) |
| 7 | Maximum annual precipitation | 923.64mm |
| 8 | Minimum annual precipitation | 306.52mm |
| 9 | Average annual relative humidity | 68.92% |
| 10 | Mean sea level pressure value | 1052.62hPa |
This paper uses the green space layout design model based on the Pix2Pix algorithm to assist the project manager to carry out the environmental design of the research community and green space layout simulation and transformation, and obtains the simulation planning results of various types of land use in the optimal design layout as shown in Table 3.
| Land type | Before transformation | After transformation | ||
| Occupied land (m²) | Occupied proportion (%) | Occupied land (m²) | Occupied proportion (%) | |
| Building roof | 3654.26 | 91.07% | 3654.2 | 82.62% |
| Road surface | 115.42 | 2.88% | 106.35 | 2.40% |
| Urban green space | 69.52 | 1.73% | 91.26 | 2.06% |
| Walkways and parking lots | 56.93 | 1.42% | 52.34 | 1.18% |
| Water float | 36.42 | 0.91% | 95.64 | 2.16% |
| Green roof | 64.26 | 1.60% | 96.35 | 2.18% |
| Solar panel | 0 | 0.00% | 265.34 | 6.00% |
| Sunken green space | 15.24 | 0.38% | 56.54 | 1.28% |
| Biostranded facilities | 0.65 | 0.02% | 4.96 | 0.11% |
| Rainwater bucket | 4 | —— | 16 | —— |
In the final green space layout design simulation of the community environment obtained with the assistance of artificial intelligence, a large number of energy-saving devices and measures are taken to achieve further reduction of community environment and building energy consumption through passive and active strategies. The passive strategy is mainly the optimization of the layout of green facilities such as solar panels and permeable paving, which fully converts natural resources into usable energy on the basis of the energy-saving requirements of the energy-saving design standards for public buildings in Shaanxi Province, in line with the mandatory requirements for two-star buildings under the Green Building Evaluation Standards. In the optimal green building spatial layout, permeable paving is the green development facility with the largest percentage of area, and more than 96% of the sidewalks, bare ground of the community environment, and parking lots and other areas in the study area are replaced with permeable paving. Restricted by the conditions of the roof renovation of residential buildings in the neighborhood and the input-benefit ratio of the facilities, the application of green roofs in the study area is less, and only some of the hard roofs of the buildings are converted to green roofs, and the percentage of green roofs application increases from 0.91% to 2.16%. In order to better dissipate runoff and purify water quality, the flat green space in the urban green space in the original neighborhood environment was transformed into sunken green space and bioretention facilities, and the percentage of sunken green space and bioretention facilities increased from 0.38% and 0.02% to 1.28% and 0.11%, respectively, after the simulation of the green layout design transformation. On the basis of the urban subsurface renovation, the optimal green space layout also incorporates rain barrels (16) to recycle rainwater, which realizes the resource utilization of some rainwater. In addition, the above analysis shows that the area is rich in solar energy resources, so the optimal layout also sets up solar panels (265.34m²) for the community buildings in order to make full use of natural resources to save non-renewable energy sources such as electricity, so as to make the green benefits of the community environment more significant. The proactive strategy mainly focuses on the layout adjustment and optimization of the HVAC system and lighting system in the residential buildings of the district. In terms of the HVAC system, the energy efficiency of the air-conditioning system’s cooling source unit is mainly improved, with the COP of the cooling performance coefficient increased by 17.42% compared with the energy-saving design standard specification for public buildings. As for the lighting system, the light source of the project adopts LED lamps with high luminous efficiency, and the lighting power density value, glare value and other indexes meet the values stipulated in the relevant standards. In addition, the public area adopts zoned lighting layout design strategy, corridors, stairwells to reduce the lighting power density, foyer to reduce the lighting power density, to achieve the purpose of according to the needs of distribution, reduce energy consumption.
In order to investigate the effect of the simulated transformation of the community environment after the green space layout design model, this paper analyzes the energy consumption of the total community environment and residential buildings before and after the optimization of the green space layout in the Designbuilder platform. The results of the analysis of the total environmental energy consumption of the neighborhood and the energy consumption of the residential building before and after the green space layout simulation transformation are shown in Table 4. Through the calculation of energy consumption, it can be seen that before the optimization of green space layout design, the total energy consumption value of the total environment building and residential building per unit area of the district is 150.84Wh/m² and 131.41kWh/m², respectively, and the overall energy consumption per unit area of the building does not satisfy the benchmark value of the energy consumption of the building of the urban district as stipulated by the Shaanxi Province. After the implementation of the layout optimization plan obtained with the assistance of the green space layout design model proposed in this paper, the simulation analysis results show that the energy consumption per unit area of the overall building is reduced in the energy consumption of cooling, heating and lighting compared with the energy consumption of the building without optimization measures. Among them, the cooling and heating energy consumption in the total environment building of the neighborhood decreased from 75.64kWh/ m² and 45.26kWh/ m² to 65.32kWh/ m² and 42.31kWh/ m², respectively. In addition, the total energy consumption energy saving optimization rate of the residential buildings reaches 15.41%, which really realizes the construction of a green and energy-saving community environment.
| Energy consumption project | Before (kWh/ m²) | After (kWh/ m²) | Energy efficiency (%) | |||
| General building | Residential building | General building | Residential building | General building | Residential building | |
| Total energy consumption | 150.84 | 131.41 | 129.18 | 111.16 | 14.36% | 15.41% |
| Refrigeration energy consumption | 75.64 | 68.52 | 65.32 | 58.94 | 13.64% | 13.98% |
| Heat consumption | 45.26 | 41.23 | 42.31 | 36.48 | 6.52% | 11.52% |
| Lighting energy consumption | 15.42 | 11.49 | 9.63 | 7.52 | 37.55% | 34.55% |
| Equipment energy consumption | 9.87 | 6.52 | 8.97 | 6.09 | 9.12% | 6.60% |
| Energy consumption in hot water | 4.65 | 3.65 | 2.95 | 2.13 | 36.56% | 41.64% |
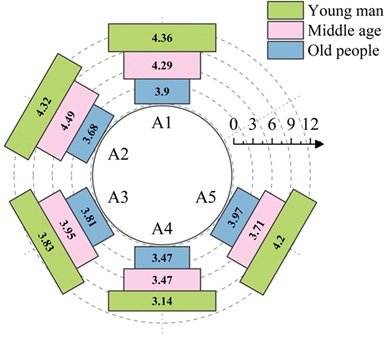
In the community environment design green space layout design optimization, optimization effect not only needs to be analyzed from the energy saving aspect, at the same time, the most important thing in the smart city environment design is to improve the public’s living satisfaction and comfort and so on. Therefore, this paper is based on literature research, summarizes the current urban community environment design in the prevalence of a number of problems and residents are more concerned about the problem, a total of five to the residents of the community to judge. Environmental green building layout design is mainly analyzed from the natural environment (A1), artificial environment (A2), green activity area (A3), reasonable distribution of facility location (A4) and energy saving measures (A5) 5 aspects. A Likert scale was used to quantify the subjective satisfaction data of young people, middle-aged people, and middle-aged and elderly people in the neighborhood on the neighborhood environment after the green space layout renovation. The results of the analysis of residents’ satisfaction with the simulated transformation of the green layout design of the buildings in this neighborhood are shown in Figure 2. Satisfaction with the natural environment, artificial environment, green activity area, and energy-saving measures all exceeded the median of 3 points on the Likert scale (4.18, 4.16, 3.86, and 3.96), indicating that young people, middle-aged people, and elderly people are in a relatively satisfactory state with respect to the neighborhood environment and buildings. In particular, the highest satisfaction with the natural environment of the neighborhood indicates that the green space layout design plan obtained with the assistance of artificial intelligence has a higher number of green vegetation and a reasonable layout. This is followed by the artificial environment, which indicates that the space layout is better managed and creates a more comfortable activity environment for the residents. The rating of reasonable distribution of facility locations slightly exceeds the median (3.36 points), indicating that further optimization is needed for the setup and layout of service and rest facilities.
In this paper, based on the Pix2Pix algorithm and Unity3D engine, etc., we propose the green space layout auxiliary design model in the design of smart city environment, and demonstrate the simulation effect of the green space layout scheme of the community environment designed under the assistance of the model through the case study, and the results show that:
(1) In order to better dissipate runoff and purify water quality, the flat green space in the urban green space in the original neighborhood environment is transformed into sunken green space and bioretention facilities, and the proportion of sunken green space and bioretention facilities is increased to 1.28% and 0.11% from 0.38% and 0.02%, respectively, after the transformation of green layout design. In addition, zoned lighting layout design strategy is adopted for public areas, with corridors and stairwells reducing the lighting power density and foyers appropriately reducing the lighting power density, so as to achieve the purpose of allocating according to needs and reducing energy consumption.
(2) After the implementation of the layout optimization scheme obtained with the assistance of the green space layout design model, the cooling energy consumption and heating energy consumption in the total environment building of the district decreased from 75.64kWh/m² and 45.26kWh/m² to 65.32kWh/m² and 42.31kWh/m², respectively. The total energy consumption energy saving optimization rate of residential buildings also reached 15.41%.
(3) Residents’ satisfaction with the retrofitted green layout design of the buildings in the neighborhood is high, especially the highest satisfaction with the natural environment of the neighborhood (4.18 points), which indicates that the green space layout design scheme obtained with the assistance of artificial intelligence has a higher number of green vegetation and a reasonable layout.
(4) The artificial intelligence model proposed in this study can assist in designing a reasonable building environment and space layout, realizing the sustainable development goal of the building, and providing valuable experience and reference for future green eco-building projects.