
The so-called green building is a high-performance building that saves resources, protects the environment and reduces pollution during the whole life cycle, provides people with healthy, comfortable and efficient use of space, and maximizes the realization of the harmonious coexistence of man and nature [1]. Under the condition of satisfying health and comfort, green building firstly emphasizes on saving energy, not polluting the environment, maintaining ecological balance, and reflecting the strategic idea of sustainable development, and its purpose is energy saving and environmental protection [2], [3]. Energy saving requires the use of new intelligent technologies in green buildings, using the “wisdom” of intelligent systems to minimize energy consumption, and specific applications in intelligent lighting systems, air conditioning, ventilation, refrigeration, heating intelligent systems, elevator group control systems, etc. [4]- [6].
Intelligent construction technology integrates a variety of intelligent technologies such as building information modeling, Internet of Things, sensors, artificial intelligence, etc., and covers the main aspects of intelligent design, intelligent construction, and intelligent operation. In the process of green building design, the use of intelligent construction technology can realize intelligent design, and through simulation analysis, it can more accurately understand and predict the performance of the building in different environments, which is conducive to the design of buildings that are more in line with the requirements of energy saving and environmental protection [7]- [9]. At the same time, intelligent construction is also embodied in the application of intelligent technology in the construction phase and operation and management phase, while the construction program is more dependent on the design program, adopting a design strategy more conducive to intelligent construction can improve the intelligent level of the construction process from the source, and ensure that the energy saving and environmental protection of the construction process [10]- [12].
In addition, the design of intelligent systems can realize the fine control of building operation, real-time monitoring and regulation of the internal environmental parameters of the building, and reduce the energy consumption and environmental pollution of building operation [13]- [15]. Therefore, the application of intelligent construction technology in green building design has strong necessity and feasibility, and it is necessary to provide convenient conditions for the development of intelligent activities in all phases, which is conducive to improving the level of intelligence and greenness in the whole process of construction, and promoting the sustainable development of buildings.
The article focuses on the core technologies of smart construction – Building Information Modeling (BIM), Internet of Things (IoT)-driven building energy management systems, and advanced building energy sampling and dynamic anomaly detection models. The article first details how BIM plays a central role in the structural design of green buildings. It then focuses on the Building Energy Management System (BEMS) based on IoT technology. It analyzes the three-layer architecture of IoT supporting BEMS, and focuses on how the application layer realizes intelligent processing and knowledge mining of the massive energy data collected in the perception layer. The four-layer architecture of BEMS itself (data acquisition layer, data storage layer, application layer, and display layer) is then introduced in detail, describing how it realizes real-time monitoring, analysis, diagnosis, alarming, and visual display of building energy consumption, thus driving the fine control and continuous optimization of building energy use. To address the problem of large sample size faced by large-scale building energy consumption research, the article proposes to use the approximation method to determine the optimal sampling sample size. Through iterative calculations, the method continuously adjusts the sample size according to the preset accuracy requirements, which ultimately improves the research efficiency significantly under the premise of ensuring the research accuracy. After obtaining representative energy consumption data, a dynamic anomaly detection model of building energy consumption based on k-center clustering algorithm is introduced. The algorithm enhances the robustness to noise and anomalies by optimizing the selection of clustering centers, and is able to more accurately identify abnormal energy consumption data that deviate from the normal pattern, providing strong technical support for the timely discovery of energy efficiency loopholes and the implementation of precise energy-saving measures.
The 3D model created by BIM technology can assist designers in creating overall structural models, local models and related structural models. In the designer’s view, the structure of a building is a key factor in determining the quality of the entire project. Visual modeling of the building structure can be realized through BIM technology, and at the same time, combined with the comprehensive study of the overall structural model, local structural model and related structural model, it can better solve the difficulties in structural force, cost, material and other aspects, and ensure the quality and stability of the structure.
There are standards and guidelines to be followed when designing the structure of a building. These guidelines are mainly reflected in the safety and stability to meet the needs of people for the safety of residential buildings. Reasonable evaluation of the building using BIM technology can effectively improve the stability and safety of the building. At the same time, the use of BIM technology to analyze the surrounding environment of the construction site, compared with the previous design plan, can find out the contradiction between the two in a certain design point, so as to optimize the design. Designers can also import the geological and climatic conditions around the construction site into the BIM system for a comprehensive analysis, from a long-term perspective of the intrinsic relationship between the structural design of the building and the environment of the construction site, to ensure that no accidents will not occur during the construction period, to ensure the safety and efficiency of construction.
In the design of building structure, it is necessary to make the structure of the building comply with the specifications, as well as to give full play to the excellent performance of the building structure, and also to ensure that the building has a certain sense of appearance. In the past, analyzing the form of a house in the structural design of a building not only consumes a lot of manpower and resources, but also causes deviations in the calculation results due to the different subjective consciousness and concerns of the users. The application of BIM technology enables designers to minimize the consumption of manpower and materials, reduce the occurrence of errors, and ensure the performance of the building.
BIM technology provides strong support for structural safety, performance optimization and environmental adaptability of green buildings in the design phase. In the construction and operation phases of the building, the realization of continuous energy saving relies on the refined management of energy use, which requires the introduction of BEMS, a building energy management system based on the Internet of Things (IoT) technology.
The structure of IoT is shown in Figure 1, including perception layer, network layer and application layer. This paper focuses on the application layer to develop a specific analysis.
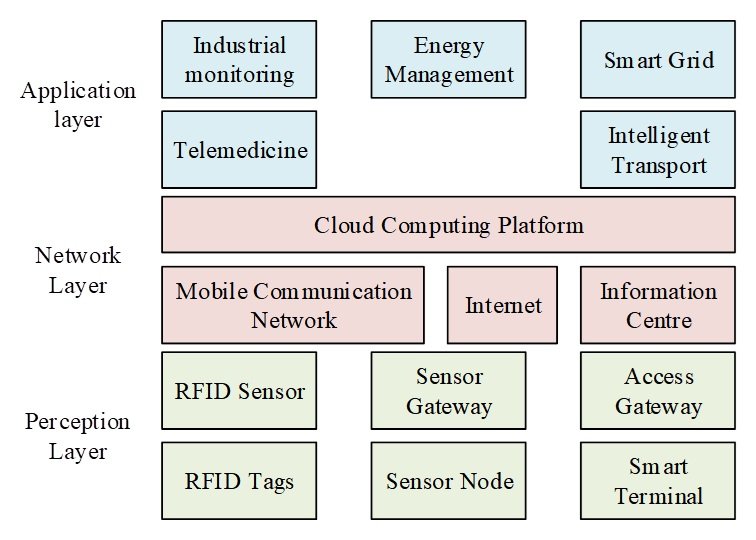
The application layer mainly includes middleware technology, object name resolution service, cloud computing, service-oriented architecture technology, IoT business platform and security. Among them, cloud computing is the core of realizing IoT, which promotes the intelligent integration of IoT and Internet. The application layer, as the top layer in the three-layer structure of IoT, can be summarized as “processing”. The application layer can identify, convert, calculate, process and mine the knowledge of the data collected in the perception layer, and provide the corresponding support platform for user applications, so as to realize the real-time control, precise control and final decision-making of the physical world. The three-layer structural system of the Internet of Things and the structure of the intelligent building energy management system are mutually corroborative, and through the application of the Internet of Things technology, the building energy management system is made more complete and more powerful.
The architecture of the building energy consumption monitoring system is divided into display layer, application layer, data storage layer and data acquisition layer, and the construction of each layer follows the unified standard specification and security system of the system.
Data Acquisition Layer: Various data collectors on site collect basic data through interface protocols.
Data storage layer: the data collected in the data acquisition layer are received, transformed and stored in the data center. As a data transit system, the data center will store and analyze all business data.
The application layer realizes the application functions and human-computer interaction functions of the system, and is divided according to the business functions such as online monitoring, comprehensive alarm, energy consumption analysis, energy-saving diagnosis, equipment management and operation service.
The display layer is used for the display of system energy consumption data monitoring and summary statistics.
IoT BEMS provides a powerful data collection, processing and analysis platform for building energy management, while scientific and efficient sampling methods and intelligent anomaly detection models are particularly important when dealing with massive building energy consumption data, especially for large-scale assessment or accurate identification of anomalies to achieve active energy saving.
After stratification is realized based on the constructed stratification model of building energy consumption samples, the sample capacity of building sampling needs to be determined. This study adopts the approximation method to determine the sample capacity, and the idea of the approximation method is: according to the different precision requirements of building sampling, to determine the coefficient of variation of the influencing factors, and to calculate the coefficient of variation of the sampling results through multiple sampling until the coefficient of variation of the building sampling results meet the precision requirements. By calculating the statistical eigenvalues of the sampling results, the method continuously approaches the optimal sample capacity, and therefore better meets the actual accuracy requirements. Sampling a representative sample of building energy consumption can reduce the number of research objects, thus improving the efficiency of the study.
The specific process of the approximation method is shown in Figure 2.
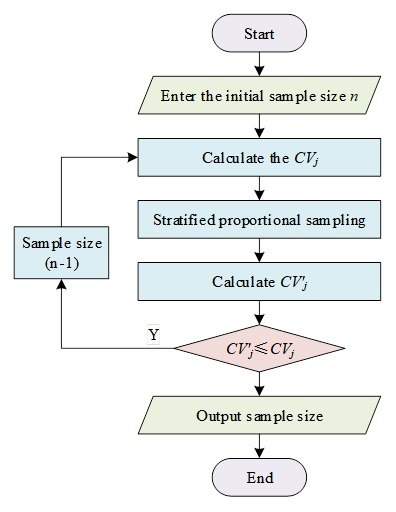
The initial sample capacity value \(u\) is set according to experience or actual situation. Then, according to the precision requirements of the study on building sampling, determine the coefficient of variation of each influence factor corresponding to this precision. The precision requirements for building sampling are generally different for different research purposes, and in this study, based on the setting of the precision requirements in the process of exploring the optimal sample size of building energy consumption, the precision requirement of \(\Delta x_{j} =0.1\bar{x}_{j}\) is adopted, and \(\bar{x}_{j}\) is the average value of the \(j\)th influence factor of the building sampling results. It is known from statistical theory: \[\label{GrindEQ__1_} \Delta x_{j} =t_{\frac{\alpha }{2} } (u-1)\frac{S_{j} }{\sqrt{u} } , \tag{1}\] where \(u\) is the building sampling sample size, \(t_{\alpha } (u-1)\) is the \(\alpha\) quantile on the \(t\)-distribution of the degrees of freedom \((u-1)\), and \(\alpha\) can generally be taken as 0.1, 0.05, 0.01, etc., depending on the specific situation, and in this study we take \(\alpha =0.01\). \(S_{j}\) is the sample variance of the \(j\)th influence factor of the building sampling results.
The coefficient of variation \(CV_{j}\) is calculated as: \[\label{GrindEQ__2_} CV_{j} =\frac{S_{j} }{\bar{x}_{j} } . \tag{2}\]
From Eqs. (1) and (2) and sampling accuracy requirements: \[\label{eq3} CV_{j} =\frac{0.1\sqrt{u} }{t_{\frac{\alpha }{2} } (u-1)} . \tag{3}\]
Eq. (3) is the coefficient of variation standard that the \(j\)th influence factor of the building sampling result should reach when the accuracy requirement \(\Delta x_{j} =0.1\bar{x}_{j}\).
After determining the coefficient of variation standard \(CV_{j}\), for the set initial sample capacity \(u\), according to the results of the stratification of building energy consumption experimental samples, the corresponding number of building energy consumption samples are randomly selected proportionally in each stratum to form the building energy consumption sample set. Calculate the actual coefficient of variation \(CV'_{j}\) of the \(j\)th influence factor of the building energy consumption sample set according to Eq. (3), compare \(CV'_{j}\) with \(CV_{j}\) to see if the coefficient of variation criterion is met, and if it meets the requirement, reduce the sample capacity \(u\). Resample and calculate, continue to compare the coefficient of variation to see if it meets the criteria, and repeat sampling until the optimal sample size is determined to meet the coefficient of variation criteria. It should also be noted that when the actual coefficient of variation \(CV'_{j}\) of the \(j\)th influence factor of the building sampling result is more than 15%, consideration should be given to discarding the coefficient of variation of the influence factor of the current sampling.
In order to distinguish the effects of energy consumption patterns with different characteristics on data anomaly detection, energy consumption data need to be clustered. Since when the average energy consumption value is used as the clustering center, certain anomalies far away from the center will cause the mean value to deviate from the actual and affect the clustering effect. In this paper, we use the \(K\) center clustering algorithm, which takes the measured energy consumption point closest to the average energy consumption value as the clustering center, for clustering. The \(K\) center clustering algorithm is robust to the presence of noise or anomalies, reduces the sensitivity to isolated points, and usually achieves high-quality clustering results.
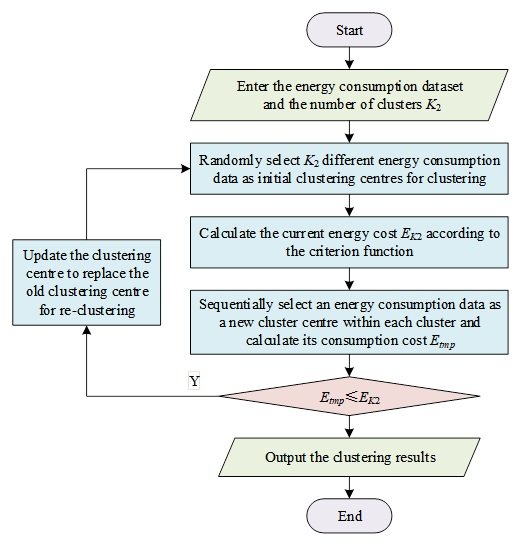
For an energy consumption dataset consisting of \(n_{2}\) objects, the number of energy clusters \(K_{2}\) is first determined. Then \(K_{2}\) energy consumption points from the energy consumption dataset are randomly selected as the initial clustering centers \((C_{1} ,C_{2} ,C_{3} ,\cdots ,C_{K_{2} } )\), and the remaining \(n-m\) data points are assigned to the energy consumption clusters according to the nearest principle to compute the consumption cost \(E_{K_{2} }\). Inside each energy consumption cluster a non-center point of energy consumption data \(C_{tmp}\) is sequentially selected to replace the cluster center \(C_{K_{2} }\), re-clustered and consumption cost \(E_{tmp}\) is calculated. Compare \(E_{tmp}\) and \(E_{K_{2} }\), if \(E_{tmp}\) is less than \(E_{K_{2} }\), which indicates that the clustering is still in the process of convergence, update \(C_{tmp}\) to be the center of energy consumption clustering. This step is repeated until \(E_{tmp}\) is not less than \(E_{K_{2} }\), at which point the center of the clusters no longer changes.
The criterion function \(E\) uses the sum of squares of the Euclidean distances between each energy consumption point and the corresponding clustering center to calculate the consumption cost, defined as follows: \[\label{GrindEQ__4_} E=\sum _{k_{2} =1}^{K_{2} }\sum _{x_{c} \in c_{k_{2} } }\left|x_{c} -C_{k_{2} } \right|^{2} , \tag{4}\] where \(K_{2}\) is the number of selected energy consumption clusters, \(C_{k_{2} }\) denotes the clustering center of the \(k_{2}\)th cluster, and \(x_{c}\) denotes the \(c\)th data in the \(k_{2}\)th cluster. The \(\left|x_{c} -C_{k_{2} } \right|^{2}\) denotes the Euclidean distance between the multidimensional (e.g., electricity consumption, water consumption, room temperature, cooling capacity…) energy consumption data \(x_{c}\) to \(C_{k_{2} }\). The flow of the \(K\) central clustering algorithm is shown in Figure 3.
The \(K\) center clustering algorithm is a method of dividing energy consumption data based on the clustering center, and it is necessary to determine the energy consumption clustering center first. However, for a large amount of energy consumption data, the computational efficiency of the \(K\) center clustering algorithm for clustering will be greatly affected. To solve this problem, this paper introduces the PSO algorithm to optimize the \(K\) center clustering algorithm so as to improve the efficiency of the anomaly detection method.
After exploring the core smart construction technologies in detail, Chapter 3 focuses on the integrated application of these technologies: based on the data collected by the IoT BEMS platform, it constructs a model for detecting building energy consumption anomalies and quantifies the energy-saving benefits, so as to translate the theoretical technologies into practical energy-saving management.
The energy consumption of a building includes the heat gain from heat transfer in the envelope, the heat gain from maintaining the indoor thermal environment, and the heat gain from the energy consumption of the cold and heat source system. There are many factors affecting building energy consumption, which are categorized into two levels: macro-influencing factors and micro-influencing factors. At the macro level, the main reasons affecting building energy consumption are population, urbanization, living conditions, science and technology, and policy implementation. From the micro level, the main reasons affecting building energy consumption are external climatic conditions, building structure and indoor conditions. External climatic conditions refer to the building’s outdoor temperature, outdoor wind speed, outdoor relative humidity, etc.; building structure includes wall materials, airtightness, ventilation, window-to-wall ratios, etc.; and indoor conditions refer to maintaining a comfortable living or working environment. What we usually refer to as building energy consumption generally refers to the operational energy consumption of a building, which involves energy consumption related to building equipment and facilities such as air conditioning, ventilation, heating, hot and cold water supply, cooking, elevator, lighting, etc. This paper starts from the micro level and determines the variable data related to building operational energy consumption based on the influencing factors of building energy consumption.
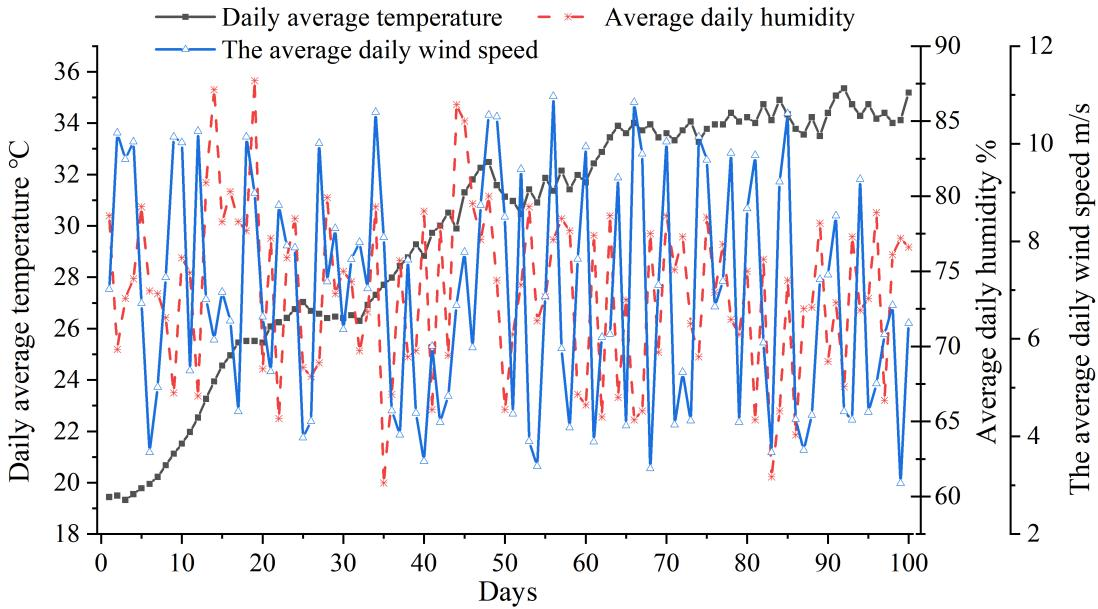
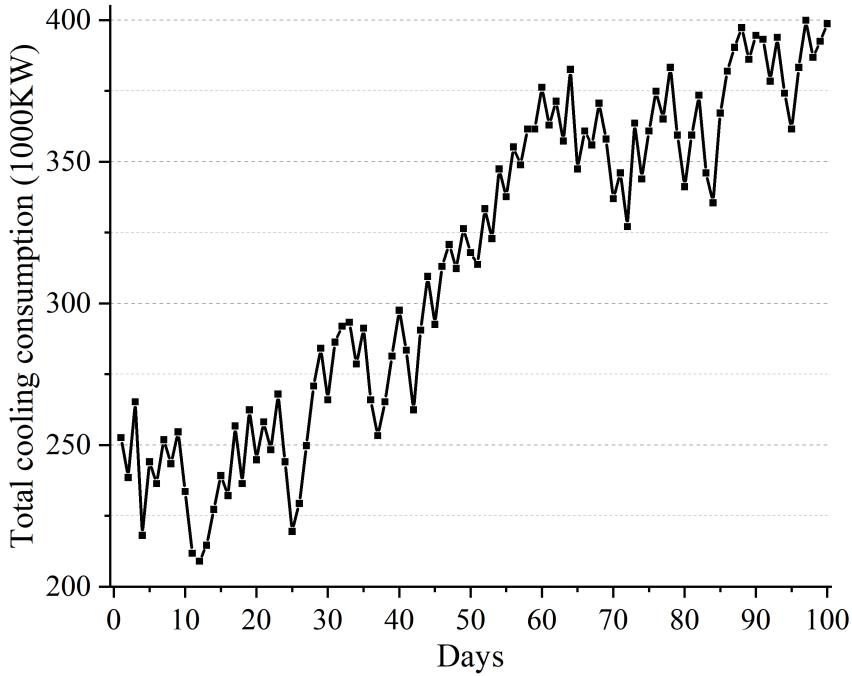
Taking an office building area in Guangdong Province as the research object, four energy consumption data, namely, average daily outdoor temperature (\(\mathtt{{}^\circ\!{C}}\)), average daily outdoor humidity (%), average daily outdoor wind speed (m/s), and the total cooling capacity of the building (KW), are extracted as the measurement indexes. Considering that the outdoor environmental factors will vary greatly with the change of seasons, and the energy consumption variables such as building cooling consumption will also fluctuate with the change of seasons, the energy consumption data set of 100 consecutive days (April 1, 2024-July 9, 2024), which has relatively small fluctuation of data and more complete energy consumption data, is selected as the original data, and the original energy consumption data matrix is obtained. Figures 4 and 5 show the curves of environmental factor variables and total building cooling consumption with the number of days, respectively.
From these two figures, it can be seen that the extracted data sets of energy consumption variables for these 100 consecutive days are relatively smooth, and the fluctuations of daily average outdoor temperature (\(\mathtt{{}^\circ\!{C}}\)), daily average outdoor humidity (%), daily average outdoor wind speed (m/s), and the total cooling consumption of the building (KW) in general with the change of seasonality are not large, which meets the requirements of the principal component modeling for the sample data of the building’s energy consumption; therefore, this set of energy consumption data can be used as principal component modeling data.
In the previous section, after extracting the micro-level building energy consumption variable data (e.g., average daily outdoor temperature, total cooling consumption) based on IoT BEMS and verifying its stability, this section applies the data after dimensionality reduction by principal component analysis, combined with the dynamic anomaly detection model, to diagnose the consecutive 100-day energy consumption sequence and identify the specific anomalous dates, which can provide a targeting basis for the energy saving measures.
By detecting the building energy consumption data of the building for a total of 100 days from April 1, 2024 to July 9, 2024, the collective anomaly detection results of the building energy consumption in non-working days on four days were identified. The results show that the time series of electricity consumption on four days were determined to be collectively anomalous, namely May 15, May 29, June 13, and July 2, 2024, and Figure 6 shows the collective anomalous detection results of electricity consumption on July 2 and the first nine days.
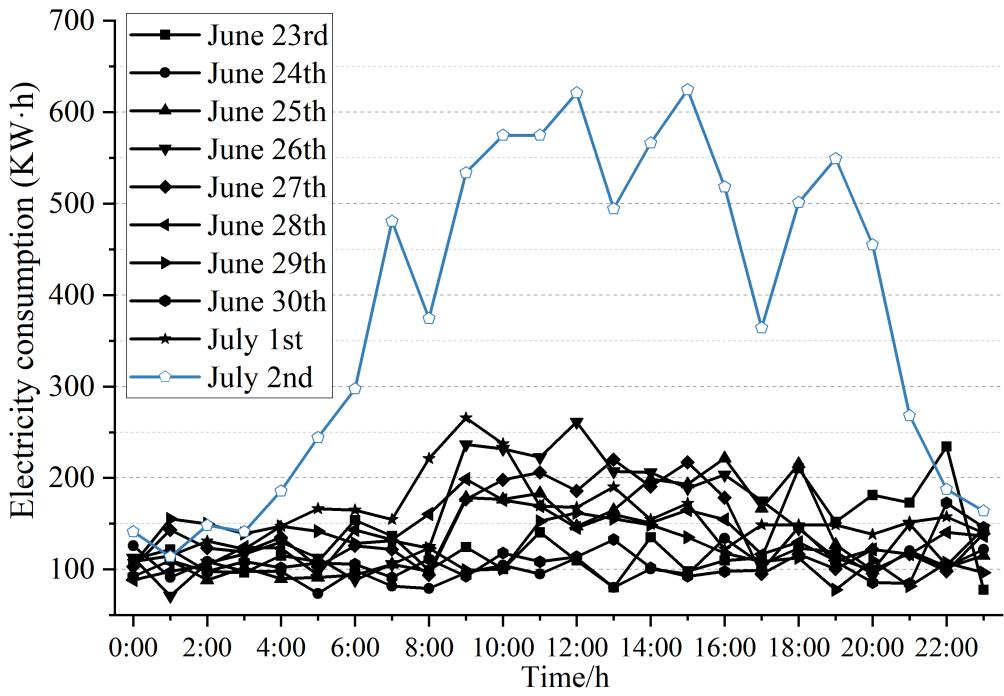
To illustrate the dynamic detection process of the anomaly detection algorithm, Table 1 shows the results of collective anomaly detection for the July 2, 2024 electricity consumption sequence. Among them, the information in bars 1 to 9 is the detection results of the normal electricity consumption sequences generated in the previous 9 days, and bar 10 is the detection results of the July 2, 2024 anomaly electricity consumption sequence. During the anomaly detection process, the historical power consumption data set will add the normal power consumption sequences to the historical data set based on the detection results and eliminate the power consumption sequences with the earliest time. Since the historical energy consumption dataset will be updated dynamically, it results in the normal threshold value of each power consumption sequence is also dynamically changed. The above analysis also demonstrates that the dynamic updating of the historical energy consumption dataset can capture the characteristics of building energy use behavior occurring over time and ensure that the algorithm accurately detects abnormal situations.
Table 1 demonstrates the collective abnormal energy consumption detection results for an office building during the period of June 23 to July 2, 2024 The total power consumption ranges from 2462.10 KW to 9124.16 KW, with a significant spike on July 2, up to 9124.16 KW, far exceeding the level of other normal days. The normal thresholds change dynamically, ranging from 1.171 to 6.892, reflecting the real-time updating nature of the historical energy consumption dataset. The normal abnormality score fluctuated from -0.616 to 0.409, with a high abnormality score of 2.509 on July 2, far exceeding the scores of other days and directly triggering the abnormal status. All other days are judged as normal and the electricity consumption is relatively stable, concentrating on 2,462.10 KW to 3,844.26 KW.This result highlights the effectiveness of the dynamic anomaly detection model: the historical dataset enables adaptive changes in normal thresholds through continuous updating, thus accurately capturing the collective anomalous event of July 2, which provides data support for the diagnosis of energy efficiency vulnerabilities.
| Date | Total electricity consumption /KW | Normal threshold | Abnormal score | Normal/Abnormal |
|---|---|---|---|---|
| June 23rd | 3080.81 | 6.782 | -0.197 | Normal |
| June 24th | 2462.10 | 3.061 | -0.616 | Normal |
| June 25th | 3277.94 | 6.611 | 0.095 | Normal |
| June 26th | 3654.18 | 3.962 | 0.181 | Normal |
| June 27th | 3428.48 | 5.121 | 0.124 | Normal |
| June 28th | 3260.09 | 6.892 | 0.063 | Normal |
| June 29th | 2986.88 | 5.288 | -0.284 | Normal |
| June 30th | 2625.23 | 3.706 | -0.347 | Normal |
| July 1st | 3844.26 | 2.924 | 0.409 | Normal |
| July 2nd | 9124.16 | 1.171 | 2.509 | Abnormal |
Based on the anomaly detection results in the previous section, this section further evaluates the active energy saving efficacy of the building energy management system. The actual energy saving rate is quantified by testing the dynamic regulation of the end-end control system fans and light fixtures, which verifies the actual benefits of the fault diagnosis model in driving the refined energy control.
In order to evaluate the energy-saving effectiveness of the system, this paper only tested the operational status of the end-end energy-saving system of the system. Figure 7 shows the parameter curves of temperature, illuminance, fan control, luminaire control, and perception on July 1, 2024, where the upper jumping edges of the fan and luminaire control curves indicate that the fan and luminaire are on and the lower jumping edges indicate that they are off, and the magnitude of the perception curve indicates the frequency of human activities. The room temperature was set to 25\(\mathrm{{}^\circ}\)C and the illuminance was set to 290 Lux.
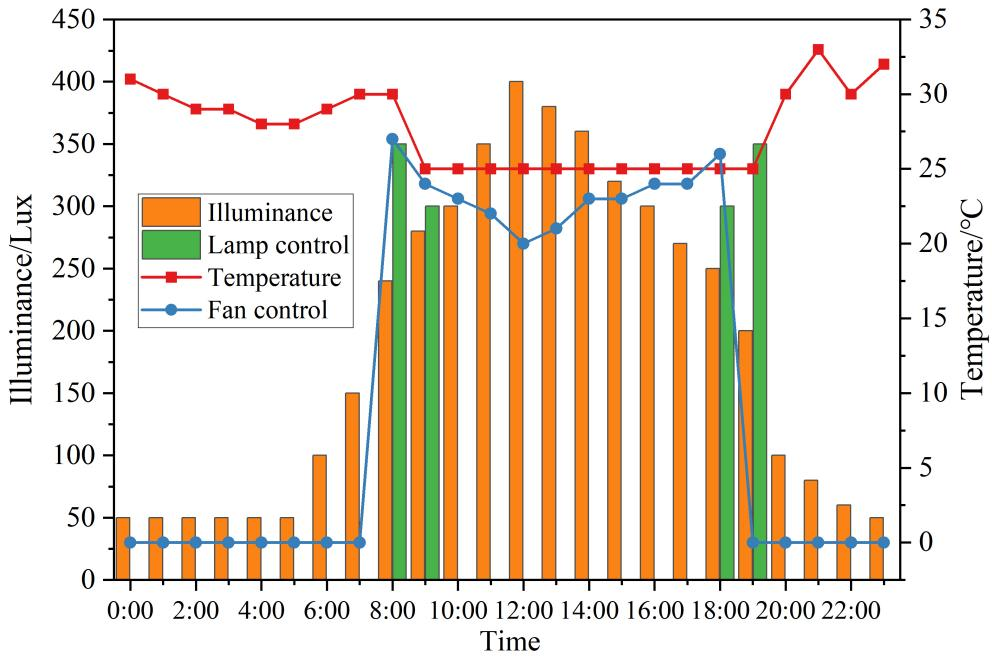
At around 8:00 a.m., the room temperature is higher than 30\(\mathrm{{}^\circ}\)C, and the illuminance is about 240 Lux for, when someone is sensed, the controller opens the luminaire switch according to the energy scheduling strategy (the upper jumping edge of the luminaire control curve), and the illuminance in the room meets the demand. The system opens the fan to start supplying cold (the upper jumping edge of the fan control curve), the temperature in the room starts to decrease automatically, and reaches the set 25\(\mathtt{{}^\circ\!{C}}\) around 9:00, with the outside sunlight enhanced, the sunlight illumination through the window can meet the human needs, and closes the switch of the lamps and lanterns (the lower jumping edge of the control curve of the lamps and lanterns). After 19:00 there is no one in the room, the system closes the fan blower (the lower jump edge of the control curve) and stops the cooling supply.
Before using the energy management system, assuming a long daytime light, long cooling supply, the energy consumption is 3844.26KW, after using the energy management system, the energy consumption is 2423.29KW, saving energy 1420.97KW. It can be seen that the energy management system is only on the utilization of the efficiency of the control of the building a day can save about 1421KW of energy, compared with the use of the system before. About 36.96% energy saving, energy saving effect is obvious.
This paper systematically investigates the application and energy-saving benefits of intelligent construction technology in green buildings, through theoretical model construction and empirical data analysis. In the data from April 1 to July 9, 2024, four days of collective anomalies are accurately identified, such as 9124.16 KW of electricity consumption on July 2, with an anomaly score of 2.509, which is far beyond the normal threshold of 1.171), while the electricity consumption on normal dates is stable in the range of 2462-3844 KW (with an anomaly score of \(\mathrm{\le}\)0.409). Based on the anomaly diagnostic results, the BEMS system automatically shuts down cooling and lighting during non-working hours by dynamically adjusting the terminal equipment. Tests show that the actual energy consumption on July 1, 2024 was only 2,423.29 KW, saving 1,420.97 KW in a single day compared with the traditional long-lighting/long-cooling mode (3,844.26 KW), with an energy saving rate of 36.96%. Intelligent construction technology provides a reliable path for green building energy saving through BIM design optimization, IoT BEMS real-time monitoring, dynamic abnormality diagnosis and active regulation strategy.
This work was supported by 2024 Jiaozuo City Government decision-making research bidding project “Jiaozuo City to promote urban renewal countermeasures”.
Yan Guo was born in Zhumadian, Henan, P.R. China, in 1988. She received the Master degree from Sichuan University of Science & Engineering, P.R. China. Now, she works in College of Traffic Engineering, Huanghe Jiaotong University, His research interests include engineering cost management, technical and economic evaluation.