
With the rapid development of China’s economy, the construction industry, as an important pillar of the national economy, has been expanding its scale and the market competition has become increasingly fierce. In the construction industry, construction project cost management, as a fundamental work, is of great significance for cost control and benefit enhancement of the project. The traditional construction project cost management method has many disadvantages, such as information silos, inaccurate data, and low management efficiency [1]- [3]. And with the updated iteration of information technology, BIM technology (Building Information Modeling), as one of the keys to digitization in the construction industry, has been encouraged and implemented by the government policy, which brings new opportunities for the standardized management of construction project cost [4]. BIM technology, as a kind of integrated 3D building modeling information technology, is able to carry out construction project full life cycle management. Through the establishment of a virtual building model, the structure of the building, equipment, materials and other information is integrated to provide a powerful data support for construction project cost management [5].
With the advantages of high precision, strong integration, good interoperability, high degree of visualization and strong simulation ability, BIM technology is able to create engineering information models in the initial stage of cost management. With the gradual progress of the project, the information of the model is enriched until the completion of the project, forming a model that can truly reflect the status of the project and provide reference in the operation stage [6]- [8]. In addition, BIM technology eliminates communication barriers through the information sharing platform, which makes the project’s multidimensional data set into a unified information model and improves the efficiency of information processing. The information sharing platform not only integrates dispersed data and improves the rate of information sharing and reuse, but also facilitates communication and management between parties and reduces communication costs [9]- [11]. With the continuous development and improvement of BIM technology, its application in the field of cost management has become increasingly mature and diverse. Although BIM technology has been widely used in cost control during the construction phase, it has been used relatively less in the pre-project and completion phases, which leads to insufficiently refined decision-making in cost management throughout the life cycle of the project, and is prone to the phenomenon of over-profiling and more changes [12], [13]. The differences in modeling standards and data formats between construction BIM and cost BIM lead to certain difficulties and complexities in data conversion and docking between the two, which affects the intelligent decision-making management of cost management [14], [15]. In order to promote the wide application and development of BIM technology in cost management, it is necessary to comprehensively consider these factors and take corresponding measures to solve them.
As a pillar industry of the national economy, the level of cost management of the construction industry directly affects the economic and social benefits of engineering projects. Traditional construction cost management mainly relies on manual experience and static data analysis, and there are problems such as information islands, lack of precision and low efficiency in information transfer, cost prediction and deepening design. With the expansion of the scale and complexity of construction projects, the requirements of construction cost management for data processing capability, precision control and intelligent decision-making are increasing. The combination of multi-intelligence body optimization algorithm and building information model (BIM) technology provides a new technical path to solve these problems. Multi-intelligence system reinforcement learning (MARL) can generate a collision-free building design that meets the design code requirements based on the given building information by simulating the interaction process between intelligences and the environment, and its theoretical framework based on Markov process introduces a more efficient decision-making mechanism for building cost management. BIM technology, on the other hand, provides a unified information platform for the whole life cycle of a building through three-dimensional visualization, information synergy and data integration. However, there is a relative lack of research on the synergistic application of multi-intelligence body optimization algorithms and BIM technology in construction cost management, especially the evaluation of the application effect in actual engineering projects needs to be explored in depth. This research constructs a multi-intelligent body reinforcement learning model based on the theories of Markov decision-making process and temporal difference learning, and realizes the path optimization and decision optimization of architectural intelligences in the raster environment through algorithms such as Q-Learning; at the same time, it develops a plug-in for deepening design of architectural costing frameworks, and realizes automatic deepening design of the frameworks based on the Revit API to improve the speed and efficiency of the deepening design; and further Propose annotation collision detection method based on hybrid enclosing box and intelligent annotation method based on reinforcement learning to solve the problem of annotation overlapping. In terms of application effect evaluation, the study chooses the ZX Middle School project in Z district of G city as an example, and conducts research from two aspects of cost comparison analysis and comprehensive benefit evaluation. The impact of BIM technology on the cost of each stage of the project is analyzed by comparing the cost consulting costs of the traditional model and BIM technology in the planning, design, bidding, construction and acceptance stages; the evaluation index system is constructed using the DEMATEL method, and a comprehensive evaluation is carried out at five levels, namely, the construction management benefit, the information management benefit, the continuity benefit, the organizational management benefit and the strategic benefit. This study aims to reveal the application mechanism and effect of multi-intelligence body optimization algorithm and BIM technology in construction cost management, to provide a more efficient and accurate cost management method for construction projects, and to provide technical support for the development of building informatization and intelligence.
Based on the required building information, structure type, building coordinates and geometric information, MARL generates collision-free 3D coordinate information of the building design. The generated design meets the requirements of the design code, such as building spacing, bending angles, and bends. The BIM model will be transformed into a raster environment representing the geometric information of the components, and based on the reinforcement learning Q-Learning, the building intelligences will select the appropriate actions in the raster environment. The final path information generated by the intelligent body will generate collision-free building information in the BIM.
In reinforcement learning, the state of an intelligent body is determined by the environment with respect to the actions performed [16]. If a variable is used to represent the state of an intelligent body, this variable is a random variable. For a random variable, there is usually a specific probability distribution that changes over time, i.e., a stochastic process. Stochastic processes emphasize the evolution “from one state to the next” in a process, and discrete Markov chains are the simplest and most desirable case. If for a sequence of random variables \(\left\{X_{n} \right\}\) describing the state of an intelligent body, for \(\forall i,j,i_{n-1} ,\cdots ,i_{0}\) (\(i,j,i_{n-1} ,\cdots ,i_{0}\) are the states of the intelligent body), the probability \(p\left(i,j\right)\) of the intelligent body moving from state \(i\) to state \(j\) satisfies Eq. (1), then the stochastic process described in the above equation is called a Markov chain: \[\label{GrindEQ__1_} p\left(i,j\right)=P\left(X_{n+1} =j|X_{n} =i,X_{n-1} =i_{n-1} ,\cdots ,X_{0} =i_{0} \right). \tag{1}\]
In a discrete Markov chain, the probabilities of transferring all states of an intelligent body to other states can be formed into a state transfer probability matrix \(P\), or transfer matrix for short, denoted as [17]: \[\label{GrindEQ__2_} P_{i,j} =p(i,j). \tag{2}\]
The term “discrete” here means that the process states are discrete or countable. Failure to meet this condition can lead to problems when studying transfer probability functions. In general, Markov chains default to the discrete case.
According to Eq. (1), the conditional probability in the definition of a discrete Markov chain, if this conditional probability can be described only by i.e., it means that the state prior to state \(X_{n}\) is independent of \(X_{n-1}\), and thus it can continue to be rewritten as: \[\label{GrindEQ__3_} p(i,j)=P\left(X_{n+1} =j|X_{n} =i\right). \tag{3}\]
The above equation indicates that the current state is only related to the previous state and not to previously experienced states, a property known as Markovianity (or no posteriority, no memory) and is determined by the definition of a Markov chain.
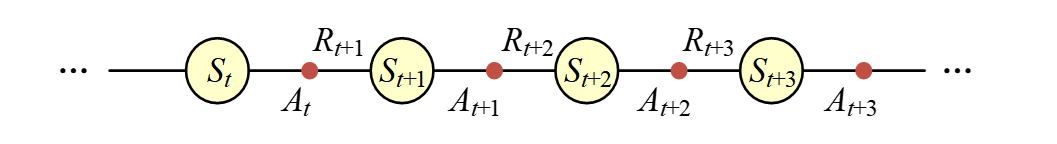
In reinforcement learning, the interaction process between an intelligent body and its environment is regarded as a Markov process. According to the reward feedback mechanism of reinforcement learning, a Markov decision process can be obtained with the sequence: \(S_{0} ,A_{0} ,R_{1} ,S_{1} ,A_{1} ,R_{2} ,S_{2} ,A_{2} ,R_{3} ,\cdots\), where \(S_{0} ,A_{0}\) is the initial state and its corresponding action. Figure 1 shows the state transfer schematic of the intelligent body.
The goal of reinforcement learning can be understood as learning an optimal policy so as to give optimal action decisions (denoted by \(\pi _{*}\)) in different states, and ultimately obtaining optimal cumulative rewards from environmental feedback. The cumulative reward can be obtained by calculating the mathematical expectation of all rewards received by the intelligent body after the current state. The cumulative rewards after the current state of the intelligent body can be defined as the reward \(G\), e.g., \(G_{t}\) denotes the cumulative rewards that the intelligent body can obtain after the state at moment \(t\).
To evaluate the expected reward of an optimal strategy in reinforcement learning, it is often necessary to define two value functions: the state value function and the action value function, which are often collectively referred to as the value functions. The state value function, denoted \(V\), computes the expected value of the long-term cumulative reward, i.e., the reward expectation. Generally, \(V_{\pi } (S)\) is used to denote the expected value of the reward at state \(S\) under strategy \(\pi\), and the state value function can be abbreviated as the state value function. The action value function, denoted as \(Q\), is similar to the state value function, but with an additional action parameter \(A\) in the function, which is generally denoted by \(Q_{\pi } (S,A)\) to indicate the expected value of the payoff when the intelligent is in the current state \(S\) and performs the action \(A\) under the strategy \(\pi\). The action-value function is sometimes called the state-action-value function because the intelligent body must be in a certain state when it does the action. The action-value function is generally referred to as the action-value function.
The state-value function estimates the value of a state, while the action-value function estimates the value of a specific action in a state [18].
Based on Markov decision process, the state value function can be defined as: \[\label{GrindEQ__4_} \begin{array}{rcl} {v{}_{\pi } (s)} & {=} & {\mathrm{{\mathbb E}}_{\pi } \left[r_{t+1} +\gamma r_{t+2} +\gamma ^{2} r_{t+3} +\cdots +\gamma ^{k} r_{t+1+k} s_{t} =s\right]} \\ {} & {=} & {\mathrm{{\mathbb E}}_{\pi } \left[\sum _{k=0}^{\infty }\gamma ^{k} r_{t+1+k} s_{t} =s\right]}. \end{array} \tag{4}\]
In Eq. (4) above, \(\mathrm{{\mathbb E}}_{\pi } \left\lfloor \cdot \right\rfloor\) is the expected value of a random variable given a strategy, \(r\) is the reward (which is generally expressed in lower case for a specific value), \(r_{t+1} +\gamma r_{t+2} +\gamma ^{2} r_{t+3} +\cdots +\gamma ^{k} r_{t+k+1}\) is the cumulative reward, i.e., the payoff, after the current state, and \(s_{t} =s\) denotes the condition when the current state is known to be \(s_{t}\). \(\gamma\) is the discount rate, \(0\le \gamma \le 1\), when \(\gamma =0\), it indicates that the intelligent body only considers the current immediate rewards and does not consider the long-term gain, when \(\gamma =1\), the intelligent body will pay too much attention to the long-term gain, which reduces the influence of the immediate rewards, and the learning efficiency is lower. Therefore the value will generally be taken between 0 and 1. The state-value function \(v_{\pi } (s)\) is the expectation of the reward, which represents the reward (cumulative reward) that can be obtained by executing the action determined by the strategy \(\pi\) to the final state in a certain state \(s\), which corresponds to the strategy \(\pi\), since the strategy \(\pi\) determines the state distribution of the reward.
Similar to the state-value function, the action-value function represents the expected total reward that can be obtained by executing action \(a\) in state \(s\), which takes the form: \[\label{GrindEQ__5_} q_{\pi } (s,a)=\mathrm{{\mathbb E}}_{\pi } \left[\sum _{k=0}^{\infty }\gamma ^{k} R_{t+1+k} s_{t} =s,a_{t} =a\right]. \tag{5}\]
In the formula, the action value function \(q_{\pi } (s,a)\) is the expectation of the reward that the intelligent body can get after executing the action \(a\) under the strategy \(\pi\) and the current state \(s\). It can be seen that for the value measurement of the action, the idea of the action value function is to quantify the value by the reward that can be obtained after executing the action \(a\) and then keep executing the strategy \(\pi\) to the final state.
Expanding from the state value function gives: \[\label{GrindEQ__6_} \begin{array}{rcl} {v_{\pi } (s)} & {=} & {\mathrm{{\mathbb E}}_{\pi } \left[\sum _{k=0}^{\infty }\gamma ^{k} r_{t+1+k} s_{t} =s\right]} \\ {} & {=} & {\mathrm{{\mathbb E}}_{\pi } \left[r_{t+1} +\gamma r_{t+2} +\cdots s_{t} =s\right]} \\ {} & {=} & {\mathrm{{\mathbb E}}_{\pi } \left[r_{t+1} +\gamma (r_{t+2} +\gamma r_{t+3} +\cdots )s_{t} =s\right]} \\ {} & {=} & {\mathrm{{\mathbb E}}_{\pi } \left[r_{t+1} +\gamma \sum _{k=0}^{\infty }\gamma ^{k} r_{t+1+k+1} s_{t} =s\right]} \\ {} & {=} & {\mathrm{{\mathbb E}}_{\pi } \left[r_{t+1} +\gamma v_{\pi } (s_{t+1} )s_{t} =s\right]}. \end{array} \tag{6}\]
The last line of the above equation is the Bellman equation in dynamic programming, which indicates that the current state value function can be decomposed into two parts, i.e., the immediate reward \(r_{t+1}\) and the discounted value of the value function for the next state.
Similarly, expanding the action value function leads to the Bellman equation for the action value function: \[\label{GrindEQ__7_} q_{\pi } (s,a)=\mathrm{{\mathbb E}}_{\pi } \left[r_{t+1} +\gamma q_{\pi } (s_{t+1} ,a_{t+1} )\left|s_{t} \right. =s,a_{t} =a\right]. \tag{7}\]
Temporal difference learning is one of the classical prediction learning algorithms [19]. Many classical model-free reinforcement learning algorithms, such as \(Q\) learning and SARSA algorithm, are based on temporal difference learning. The idea of temporal difference learning is first introduced in the following.
In the specific computation, given the policy \(\pi\), the temporal difference method will update the value function \(V\), including the state value function and the action value function, for the emergent current state \(S_{t}\). In a certain learning round, the intelligent body arrives at any state \(S_{t}\) and can update the value function \(V\). At the moment \(t\), the state of the intelligent body is \(S_{t}\), and then the intelligent body can enter the next state \(S_{t+1}\) after doing an action according to the policy, and get an environmental feedback reward \(R_{t+1}\). During the learning process, for any state \(S_{t+1}\), there is a corresponding \(V(S_{t+1} )\), and when the learning just starts, the \(V(S)\) of all states can be initialized with arbitrary values, generally assigned to 0. For the \(S_{t}\) state of the intelligent body, the value function of the \(S_{t}\) state (this round of learning) can be used with the \(R_{t+1}\) and the \(V(S_{t+1} )\) for the \(S_{t}\) state. The value function of the state (learned in this round) is updated: \[\label{GrindEQ__8_} V(S_{t} )\leftarrow V(S_{t} )+\alpha \left[R_{t+1} +\gamma V(S_{t+1} )-V(S_{t} )\right]. \tag{8}\]
The above equation is a specification in the field of reinforcement learning for the update method of the temporal difference algorithm. In the above equation, \(R_{t+1} +\gamma V(S_{t+1} )\) is the computational result of the current round of learning, while \(V(S_{t} )\) on the right-hand side of the above equation is the \(S_{t}\)-valued function estimate from the previous round of learning. Updating Eq. (8) with arrows to indicate assignments and habitually omitting the round number corner notation. The \(R_{t+1} +\gamma V(S_{t+1} )-V(S_{t} )\) is the difference between the value function estimate of the current round and the previous round, and then this difference is multiplied by a learning rate \(\alpha\) which is less than 1 and added to the \(V(S_{t} )\) of the previous round, which means that the intelligent body harvests a new reward and then performs a knowledge updating on the old experience. The learning rate \(\alpha\) takes a generally small value to avoid affecting convergence at a later stage.
The TD(0) update represents the difference between the estimated \(V\)-value of \(S_{t}\) and its other estimate \(R_{t+1} +\gamma V(S_{t+1} )\), which is referred to as the temporal difference error, and is expressed in the form of (the exact form is not given in the text): \[\label{GrindEQ__9_} \delta _{t} =R_{t+1} +\gamma V(S_{t+1} )-V(S_{t} ). \tag{9}\]
The temporal difference error is the error of the estimate made at each moment. Since the TD error depends on the next state and reward, it is not computed until the next moment step,i.e., \(\delta _{t}\) is the estimation error of \(V(S_{t} )\), computed at the moment of time \(t+1\). Note that if the estimated \(V\) value does not change during a training cycle, the sum of the time-series difference errors can be written in the following form: \[\label{GrindEQ__10_} \begin{array}{rcl} {G_{t} -V(S{}_{t} )} & {=} & {R_{t+1} +\gamma G_{t+1} -V(S_{t} )+\gamma V(S_{t+1} )-\gamma V(S_{t+1} )} \\ {} & {=} & {\delta _{t} +\gamma (G_{t+1} -V(S_{t+1} ))} \\ {} & {=} & {\delta _{t} +\gamma \delta _{t+1} +\gamma ^{2} (G_{t+2} -V(S_{t+2} ))} \\ {} & {=} & {\delta _{t} +\gamma \delta _{t+1} +\gamma ^{2} \delta _{t+2} +\cdots +\gamma ^{T-t-1} \delta _{T-1} } \\ {} & {} & {+\gamma {}^{T-t} (G{}_{T} -V(S{}_{T} ))} \\ {} & {=} & {\delta _{t} +\gamma \delta _{t+1} +\gamma ^{2} \delta _{t+2} +\cdots +\gamma ^{T-t-1} \delta _{T-1} } \\ {} & {} & {+\gamma {}^{T-t} (0-0)} \\ {} & {=} & {\sum _{k=t}^{T-1}\gamma ^{k-t} \delta _{k} }. \end{array} \tag{10}\]
The above equation is not exact if there is an update of the \(V\) value in the middle of a training cycle, but it can still remain approximate if the step size is small, and this error plays an important role in the theory and algorithms of temporal differential learning.
In actual construction, limited by design methods and tools, the deepening design of the building cost framework is mainly completed initially by the constructor according to the structural design and construction requirements. In the actual processing process, the trial-and-error method is usually used to solve possible constructability problems such as dimensional deviation, positional deviation and building collision. This paper has introduced about the construction optimization design and intelligent scheduling of the building cost framework in the deepening design stage, which improves the practicability and constructability of the design scheme to a certain extent. However, there is still a lack of 3D visualization methods based on the deepened design scheme of the building cost framework. Therefore, this section develops the building cost framework deepening design plug-in to realize the automated modeling of BIM models for a large number of buildings and the beam and column components belonging to them.
In order to realize the construction cost framework BIM automatic modeling, through the secondary development of Revit software, the creation of the framework automatic deepening design plug-in to improve the speed and efficiency of deepening design [20]. The main way of Revit secondary development is based on the development of external plug-ins based on the Application Programming Interface (API), which is pointed to and read through the .addin file.The Revit API is mainly used to Extend Revit functionality, suitable for automating repetitive tasks. Revit plug-ins through Visual Studio software to create a class library project, based on the Revit API provides the relevant functions using the C# language to write code and debug the program to achieve the intended function. Through the Revit plug-in to build a channel for data cascade in different design stages, create BIM models based on the deepened design scheme, automatically generate instances of beams, columns, and architectural elements, thus breaking the traditional mode of manual modeling and reducing the working time for building BIM models.
In the two-story building cost frame, there are 46 frame columns with 400mm x 400mm cross-section and 3600mm storey height, and there are 68 frame beams with 200mm (width) x 300mm (depth) rectangular cross-section. According to the result of building optimization design, there are 4 corner bars of 20mm diameter and 8 side bars of 14mm diameter in each column, which makes a total of 552 column constructions, while there are 4 14mm diameter constructions at the top and bottom of each beam, which makes a total of 736 beam constructions. The large number of beam and column members and the large number of buildings they contain made it difficult and inefficient to build the BIM model manually. After the intelligent arrangement of the buildings, the position and shape of the buildings in the frame are adjusted, and the buildings cannot be added to the BIM model by the rule-based parameterization method, and manually building the building model increases the chances of misplacing and omitting the buildings, which affects the quality and speed of the BIM modeling. In order to realize the deepening design of the overall framework, based on the structural design results of this framework, the building optimization design method based on NFO algorithm is used to calculate the building configuration scheme for each part of the beam and column components, and the building intelligent scheduling method based on hybrid algorithm of artificial potential field and path optimization is used to calculate the building scheduling scheme. Based on the deepening design results of the framework, the BIM model of the two-story building costing framework containing the building is automatically generated by the developed Revit plug-in.
In order to present the deepened design plan in detail, the labeling in the machining drawings describing the dimensions and locations of the objects is very important. In the first two subsections, a 3D visual BIM model is automatically generated using the developed Revit plug-in. The projection or sectioning of the 3D BIM model can be used to obtain 2D contour lines at appropriate angles, and 2D machining drawings are generated by adding correct and highly readable dimensioning. However, the selection and adjustment of dimensioning forms and positions are mostly dependent on the architect’s design habits and building experience. When the component model has complex graphics and many elements, the problem of overlapping graphics often occurs in the densely labeled drawings, which affects the accuracy and readability of the drawings.
In 2D planar space, an AABB is a rectangle enclosing the target geometry, with each side parallel to one of the coordinate axes.The AABB is constructed in a relatively simple way by finding the maximum values \(x_{\max }\), \(y_{\max }\) and minimum values \(x_{\min }\), \(y_{\min }\) of the projections of the geometry to the \(x\) and \(y\) axes, respectively. The coordinates of the two endpoints of the diagonal of the rectangular enclosing box, which can be obtained, are denoted as \(R_{xy} =\left\{(x,y)|x_{\min } \le x\le x_{\max } ,y_{\min } \le y\le y_{\max } \right\}\). The intersection of two AABBs is judged by whether the projections of the two coordinate axes of \(XY\) all overlap. Therefore, the construction of AABB is simple and the intersection detection is fast, however, the encircling compactness for geometries that are not parallel to the coordinate axes is poor and the intersection detection accuracy is not enough.
The enclosing sphere is a simpler shape of the enclosing box, and in 2D space, the enclosing sphere can be downscaled to a circular enclosing box, i.e., it completely encloses the target geometry in the smallest circle. The circular enveloping box is also constructed in a simpler way: firstly, the AABB of the target geometry is found, and then the geometric center of the AABB is taken as the center of the circular enveloping box, \(C\), which is expressed as: \(C(c_{x} ,c_{y} )=(1/2)(x_{\max } -x_{\min } ),(1/2)(y_{\max } -y_{\min } )\), and the diagonal of the AABB is the diameter \(d\) of the circular enclosing box, denoted by \(d=\sqrt{\left(x_{\max } -x_{\min } \right)^{2} +\left(y_{\max } -y_{\min } \right)^{2} }\). The intersection detection of two circular enclosing boxes is the simplest and only requires determining the relationship between the distance between the two centers and the sum of the two radii. However, the redundant space around the target geometry is occupied by the circular enclosing boxes, and the tightness is the worst.
OBB also completely wraps the target geometry by a rectangle, with the size and direction of the rectangle determined by the shape of the geometry itself. The two symmetry axes of the rectangle are not necessarily parallel to the coordinate axes, and the tightness of the wrapping can be improved by adjusting the orientation of the rectangle.
Through the collision detection method based on hybrid enclosing box, the overlapping problem between the annotation to be drawn and the original graphic in the drawing can be quickly determined. In the manual drawing process, if the overlapping problem of the annotation is found, the architect can adjust the position of the annotation according to the positional relationship between the graphics through specific principles until the region without overlap is found. However, when the number of graphics and annotations in the drawings is large, it is difficult to avoid overlapping annotations by arbitrarily adjusting the position of annotations, and it is more time-consuming and laborious to adjust annotations. In order to intelligently solve the annotation collision problem and find a reasonable layout of annotations, this subsection proposes an intelligent annotation method based on reinforcement learning.
Reinforcement learning (RL) is a decision-making algorithm, in which an intelligent body obtains the optimal decision by interacting with the environment for a limited number of times, attempting different actions to obtain corresponding rewards, and aiming to maximize the expected cumulative rewards. In actual drawing, engineers need to make decisions on how to determine the location of annotations in order to avoid overlapping with the original drawings and at the same time to ensure the readability and reasonableness of the drawings. To this end, engineers usually execute the corresponding drawing decisions according to different situations, evaluate the decisions based on the drawing effect and summarize the experience. In reinforcement learning, intelligences also adopt the above learning strategies to learn strategies to achieve goals through repeated trial and error.
The mathematical model of reinforcement learning can be summarized as a Markov Decision Process (MDP), which is usually represented by a quintuple \(\left\{S,A,P,R,\gamma \right\}\) comprising the set of states \(S\), the set of actions \(A\), the probability of a state transfer \(P\), the reward for rewarding \(R\) and the discount factor \(\gamma\). At moment \(t\), an intelligent body in state \(s_{t}\) makes an action \(a_{t}\) through some strategy \(\pi\), obtains a reward \(r_{t}\) from the environmental feedback, and evaluates the strengths and weaknesses of the previous behavior according to the reward obtained, on the optimization of the chosen strategy. The strategy \(\pi\) is a mapping from state \(s\) to behavior \(a\) and represents a function of the choice of action \(a\) in state \(s\). To evaluate the merits of the strategy \(\pi\), the expected reward obtained by an intelligent taking a series of actions \(a_{t} ,a_{t+1} ,\cdots a_{t+k} ,\cdots\) according to a certain strategy starting from the state \(s_{t}\) at the moment \(t\) is calculated by constructing the state-behavior value function (11): \[\label{GrindEQ__11_} Q(s,a)=E\left[\sum _{k=0}^{\infty }\gamma ^{k} r_{t+k+1} \left|s_{t} \right. =s,a_{t} =a\right]. \tag{11}\]
By estimating and optimizing the state-behavior value function, the traditional Q-learning algorithm based on (12) is used to update the value function \(Q(s,a)\), build the \(Q\) table, and find the optimal policy: \[\label{GrindEQ__12_} Q(s,a)=Q(s,a)+\alpha \left(r+\gamma \max Q(s',a')-Q(s,a)\right), \tag{12}\] where, \(\alpha\) is the learning rate, \(\gamma\) is the discount factor, \(s'\) represents the next moment state, and \(a'\) represents the action taken in the next moment state. Where the learning rate is related to the speed of convergence, and the discount factor considers the effect of future rewards.
In this section, the application of multi-intelligent body BIM in cost management of school house project in construction project is investigated by introducing the building cost consulting cost and the comparison with the building cost consulting cost of this project in traditional mode is shown in Figure 2.
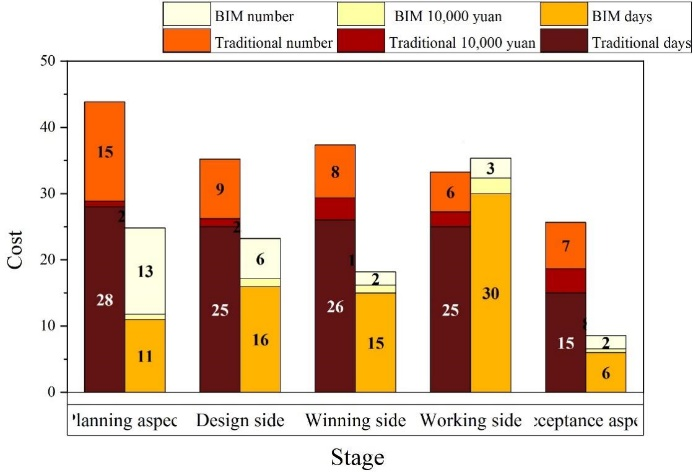
The construction cost consulting costs spent on planning aspect, design aspect, bidding aspect, construction aspect and acceptance aspect under BIM technology are 0.8065, 1.1987, 1.1645, 234.85 and 0.5448 million yuan, totaling 60.63 million yuan. Compared with the cost consulting of 112,872,000 yuan for the project in the traditional mode, the university campus project using BIM technology saved 52,242,000 yuan in terms of cost consulting. In addition, the application of BIM technology is significantly better than the traditional model in terms of the number of days and manpower required in all phases of construction cost management, and BIM technology significantly shortens the time cycle of construction cost management and reduces the required manpower input. This advantage not only reflects the excellent ability of BIM in fine management, but also shows that it can effectively save social resources and bring higher social and economic benefits for construction projects.
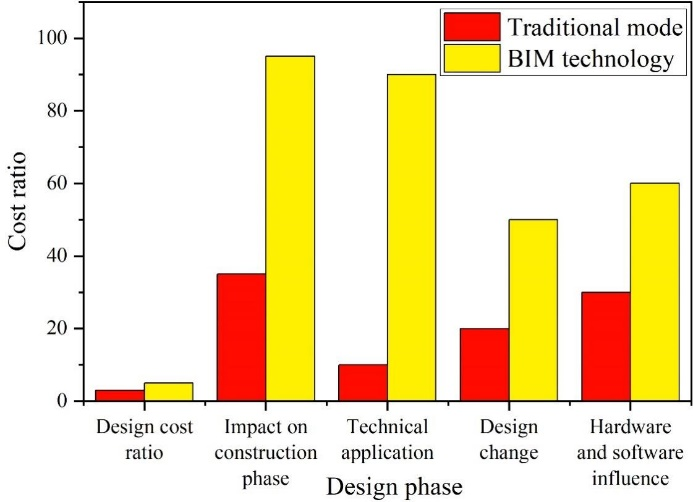
The multi-intelligent body BIM database information in the design stage can realize the limit, which ensures both the economy and rationality of the engineering design. Cost estimation using building information modeling can not only get more accurate cost estimation, but also cost estimation from details. The corresponding cost documents involved in the design stage are the design scheme estimates, design estimates and construction drawing budgets, and the effective control of the cost is realized in the design stage through the BIM technology for the design scheme preference or limit design, the multi-disciplinary consistency check of the design model, the design estimates, the preparation and review of the construction drawing budgets, and the comparison of the cost in the design stage is shown in Figure 3.
The cost of using B multi-intelligent body BIM for construction design is higher than the traditional construction design growth of about 28%, which is mainly due to the use of BIM technology for design, the need for designers to practitioner quality, the cost of software and hardware are higher than the traditional construction design, in the design stage of the model but also through the multi-disciplinary collision check, applied to different functions of the BIM technology, the pre-modeling modifications more often, and The model designed by BIM technology should be used throughout the construction stage and the use stage.
Under the application of BIM technology to carry out engineering modeling work, the generation and classification of relevant components are implemented based on the structure in the BIM-Revit system. Moreover, the spatial information and positional relationships of the different building components are clarified with the assistance of diagram elements and coordinate patterns. Modeling of structural frame beams using BIM technology.
Based on the application of Revit information modeling, the relevant elements and information data in the traditional design field can be organically integrated to form a unified whole. In the model, the component information is its core, the actual situation of the building can be well reflected, and the characteristics of the building itself. Therefore, modeling has become a key link in the cost control of intelligent building projects. During the implementation of engineering cost control, combined with the main structural model out of GMT components, the amount of work is scientifically and reasonably calculated with the help of its own calculation tools within the software. By comparing the traditional project cost control method with the method described in this paper, its application effect in project cost control is analyzed, as shown in Figure 4.
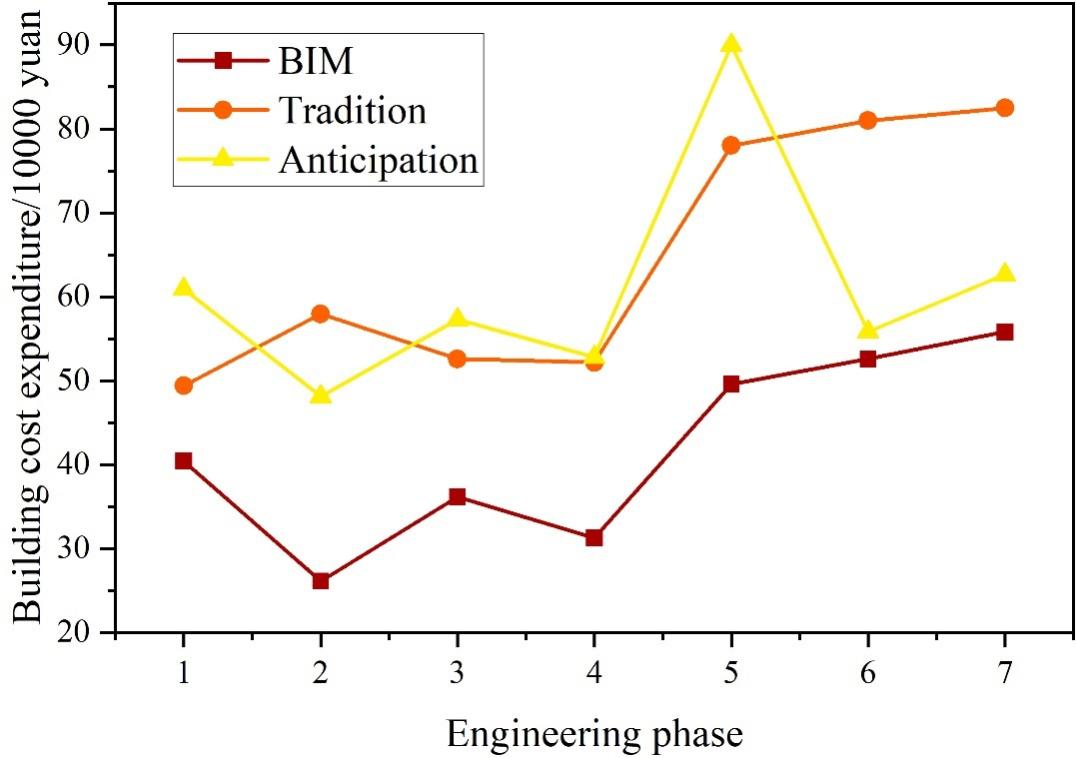
The method described in this paper can control the construction cost well, and the expenditure of each process does not exceed 600,000 yuan, while the traditional construction cost control method obviously exceeds the expected amount, and the sum of traditional construction cost expenditure is 4,536,199,000 yuan, which is far beyond the expected 4,275,823,000 yuan. It can be seen that the application of BIM technology to control construction cost shows higher value.
This project is a construction project based on the application of BIM technology, the name of the project is ZX Middle School in Z District of G City, which is constructed by G City Urban Construction Group. The total investment of the project is 657 million RMB, and the building area is 77020 m2, of which the surface area accounts for 69,065.85 m2 and the underground area accounts for 10,396.92 m2, and the scale of the construction project is 48 junior high school classes. The project includes a teaching building, an administrative complex, common classrooms, an auditorium, a stadium, a performance center with a capacity of 800, a cafeteria, a student dormitory, a teacher’s dormitory, and auxiliary rooms. Teachers’ and students’ dormitories are assembled buildings with an assembly rate of 56%, and the dormitory building and teaching building use prefabricated assembled components, which are prefabricated columns and prefabricated internal partition walls. As the project uses BIM technology in depth for project construction, BIM technology is introduced from the design stage, production stage, construction stage and completion stage for simulation and management, which effectively solves the shortcomings of the traditional construction cost project in the early stage, therefore, this paper selects the ZX Middle School project to conduct the research on the comprehensive benefits of BIM technology.
The ZX middle school project selected in this case belongs to assembly building, which has the characteristics of shortened construction period, controllable quality, resource saving, environmental friendliness and flexible and expandable, etc. These characteristics make the assembly building become an efficient and sustainable construction mode.
Shortened construction period: The assembly building of ZX Middle School Project adopts prefabricated components, which can be processed and assembled in the factory and synchronized with the on-site construction, which significantly shortens the construction period and improves the project’s schedule control ability.
Controllable quality: The various assembled buildings of the ZX Middle School project are able to ensure the size, quality and precision of the components through factory production. The quality control and strict process flow under factory conditions can reduce the chance of construction site and improve the overall construction quality.
Resource saving: The project’s assembly building maximizes the use and recycling of construction materials, reducing waste and environmental load. At the same time, the factory production can improve the utilization rate of materials, reducing wastage and consumption.
Environmentally friendly: The ZX High School project’s industrialized approach to the production of the assembly building can reduce the environmental impact and the generation of noise, dust and emissions. It is also possible for the assembly building to utilize building materials and construction techniques that consume less power and are more environmentally friendly, reducing the consumption of natural resources.
Flexibility and Expandability: the assembled building for the ZX Middle School project is modular in design and can be flexibly assembled and disassembled as needed. This reusability and expandability makes the assembled building suitable for building projects of different sizes and uses.
This paper establishes a questionnaire for the mutual influence relationship between evaluation indicators, the questionnaire is in the form of a matrix for pairwise influence degree scoring between 15 evaluation indicators, and the degree of direct influence between evaluation indicators is divided into 5 levels: unqualified, qualified, medium, good, excellent, corresponding to the value of 5-1 points, respectively, the questionnaire will be issued to the senior BIM experts in the field of municipal engineering and the questionnaire will be Recycling summary, the total number of survey respondents is 10, 10 questionnaires were issued and 10 valid questionnaires were recovered, which meets the requirements of 8-15 experts of DEMATEL method.
For the comprehensive influence matrix T, calculate the corresponding influence degree R and influenced degree C according to its content, and get the center degree and reason degree of each dimension of the index based on the influence degree and the influenced degree, and Table 1 shows the center degree and reason degree of each dimension of the evaluation index of the benefits of BIM technology application. Among them, the cause degree of enhancing enterprise competitiveness is the lowest, -1.805, and the factor attribute belongs to the result dimension, and the cause degree of 3D visualization is the highest, 1.4453, and belongs to the cause dimension.
Drawing the cause and effect diagram, as shown in Figure 5, the center degree-cause degree diagram, the horizontal coordinate center degree represents the degree of closeness of the relationship between each dimension and other dimensions, that is, the higher the center degree of a certain dimension, indicating that the dimension is more closely related to other dimensions. Vertical coordinate cause degree, the positive value represents the cause dimension, that is, the dimension affects other dimensions, the larger the value indicates the higher degree of influence on other dimensions, the negative value represents the result dimension, that is, the dimension is affected by other dimensions, the smaller the value indicates the higher degree of influence on other dimensions.
| Dimension | Influence degree (R) | Degree of influence (C) | Centrality (R+C) | Degree of cause (R-C) | Factor attribute |
| Quality improvement(C1) | 0.8748 | 1.5948 | 2.4696 | -0.72 | Result dimension |
| Period of savings((C12) | 0.8045 | 1.5466 | 2.3511 | -0.7421 | Result dimension |
| Improve the safety of construction process(C3) | 0.8398 | 1.7485 | 2.5883 | -0.9087 | Result dimension |
| Collision check(C4) | 1.5498 | 0.6185 | 2.1683 | 0.9313 | Reason dimension |
| Cost saving(C5) | 1.1648 | 1.7985 | 2.9633 | -0.6337 | Result dimension |
| Information collaborative sharing(C6) | 1.8985 | 1.0468 | 2.9453 | 0.8517 | Reason dimension |
| Three-dimensional visualization(C7) | 2.1365 | 0.6912 | 2.8277 | 1.4453 | Reason dimension |
| Complete improvement of data(C8) | 1.6988 | 0.6285 | 2.3273 | 1.0703 | Reason dimension |
| Sustainable construction(C9) | 0.8496 | 0.9948 | 1.8444 | -0.1452 | Result dimension |
| BIM+ auxiliary decision(C10) | 1.8465 | 0.8342 | 2.6807 | 1.0123 | Reason dimension |
| Environmental testing green(C11) | 0.6693 | 0.2756 | 0.9449 | 0.3937 | Reason dimension |
| Talent culture(C12) | 0.9548 | 0.8345 | 1.7893 | 0.1203 | Reason dimension |
| Improve communication efficiency(C13) | 1.5169 | 0.8536 | 2.3705 | 0.6633 | Reason dimension |
| Improve corporate competitiveness(C14) | 0.3498 | 2.1548 | 2.5046 | -1.805 | Result dimension |
| Improve customer satisfaction(C15) | 0.3648 | 1.8498 | 2.2146 | -1.485 | Result dimension |
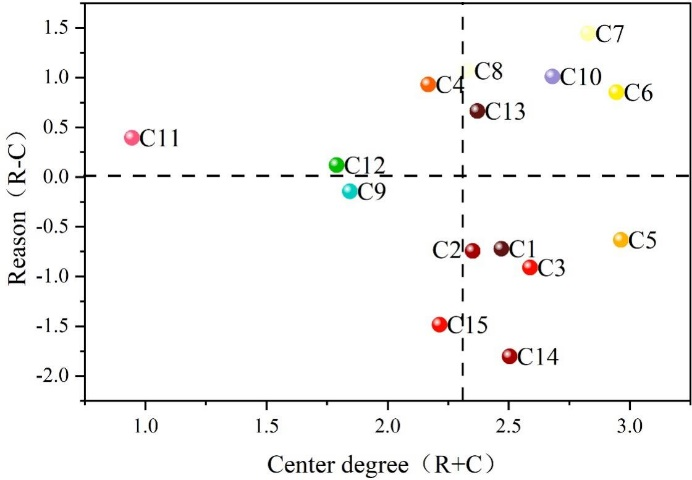
Cost saving (C5) has the highest degree of centrality (2.9633), indicating that this dimension has the closest relationship with other dimensions, and environmental testing green (C11) has the lowest degree of centrality (0.9449), indicating that this dimension has the lowest degree of closeness with other dimensions. The centrality of environmental testing green (C11), talent training (C12), sustainable construction (C9), collision inspection (C4), enhancement of customer satisfaction (C15), and enhancement of the completeness of the construction data (C8) are 0.9449, 1.7893, 1.8444, 2.1683, 2.2146, and 2.3273, respectively, which are lower than the mean value of centrality of 2.3327. Informationization is the foundation of BIM technology, and a series of dimensions such as safety, quality, schedule and so on in project construction are transferred through BIM technology, so information sharing (C6) has a close connection with other dimensions. Project construction using a new management approach there are certain inputs and outputs, the ultimate goal is to reduce project costs, the application of BIM technology in project construction in all dimensions, have different degrees of impact on the project construction costs.
Through the example study, among the dimensions affecting the benefit indicators of BIM technology application in the ZX assembly building cost project, those in the first and second quadrants are the cause factors, and those in the third and fourth quadrants are the result factors, among which, in the first quadrant, information collaborative sharing (C6), three-dimensional visualization (C7), improvement of the completeness of the construction information (C8) BIM+assisted decision making (C10), and improvement of the communication efficiency (C13) are key factors.
Table 2 shows the evaluation results of the comprehensive benefit index of BIM technology in ZX middle school, through the comprehensive evaluation results can be learned, the comprehensive benefit score of BIM technology in the application process of ZX middle school project is 83.0945 points, between 80-90 points, the corresponding evaluation interval is relatively good, which indicates that the comprehensive benefit level of BIM technology in the application process of ZX middle school project is relatively good.ZX Middle School assembly building project as a whole is relatively sustainable, and the comprehensive benefit scores of each stage are between 80-85 points, the corresponding evaluation interval is relatively good, which indicates that the project did not have serious disadvantages in these five stages and did not seriously affect the comprehensive benefits of the project.
| Target layer | Primary indicator | Score | Secondary indicator | Score |
|
Based on the optimization of the
application benefit evaluation index system of BIM building cost (83.0945) |
Construction management benefits | 83.7968 | Quality improvement | 85.1545 |
| Period of savings | 82.5364 | |||
| Improve the safety of construction process | 85.0486 | |||
| Collision check | 83.5154 | |||
| Cost saving | 77.5948 | |||
| Information management benefits | 81.9452 | Information collaborative sharing | 80.2498 | |
| Three-dimensional visualization | 82.5698 | |||
| Complete improvement of data | 85.5645 | |||
| Sustainable benefit | 82.3448 | Sustainable construction | 73.0495 | |
| BIM+ auxiliary decision | 85.0469 | |||
| Environmental testing green | 87.9468 | |||
| Organizational management benefits | 81.1648 | Talent culture | 84.0485 | |
| Improve communication efficiency | 82.0654 | |||
| Strategic benefit | 82.9865 | Improve corporate competitiveness | 74.5486 | |
| Improve customer satisfaction | 84.4865 |
Table 3 shows the evaluation of the coefficients of the grade of each indicator at the program level, and in the BIM benefit indicators of building cost management based on multi-intelligence and BIM technology, all the indicator grades belong to good and above, and the number of indicators that are in the excellent grade is 8, and the number of indicators that are in the good grade is 7.
| / | Unqualified | Qualified | Medium | Good | Excellent | Grade | |
| C1 | Quality improvement | 0 | 0 | 0.0001 | 0.1925 | 0.8074 | Excellence |
| C2 | Period of savings | 0 | 0 | 0.0348 | 0.9545 | 0.0107 | Good |
| C3 | Improve the safety of construction process | 0 | 0 | 0.0078 | 0.4925 | 0.4997 | Excellence |
| C4 | Collision check | 0 | 0 | 0 | 0.0185 | 0.9815 | Excellence |
| C5 | Cost saving | 0 | 0 | 0.0056 | 0.9153 | 0.0791 | Good |
| C6 | Information collaborative sharing | 0 | 0 | 0 | 0.0348 | 0.9652 | Excellence |
| C7 | Three-dimensional visualization | 0 | 0 | 0.0035 | 0.8468 | 0.1497 | Good |
| C8 | Complete improvement of data | 0 | 0 | 0.0125 | 0.9465 | 0.041 | Good |
| C9 | Sustainable construction | 0 | 0 | 0.0598 | 0.0345 | 0.9057 | Excellence |
| C10 | BIM+ auxiliary decision | 0 | 0 | 0.0314 | 0.9345 | 0.0341 | Good |
| C11 | Environmental testing green | 0 | 0 | 0.0012 | 0.9536 | 0.0452 | Good |
| C12 | Talent culture | 0 | 0 | 0 | 0.1966 | 0.8034 | Excellence |
| C13 | Improve communication efficiency | 0 | 0 | 0.0002 | 0.0636 | 0.9362 | Excellence |
| C14 | Improve corporate competitiveness | 0 | 0 | 0.1345 | 0.1056 | 0.7599 | Excellence |
| C15 | Improve customer satisfaction | 0 | 0 | 0.0001 | 0.8848 | 0.1151 | Good |
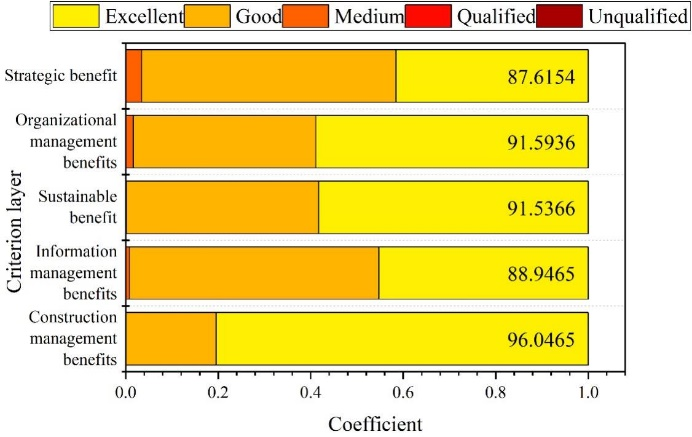
Figure 6 shows the determination of benefit levels and ratings. The ratings for the five dimensions of construction management benefits, information management benefits, continuity benefits, organizational management benefits, and strategic benefits are 96.0465, 88.9465, 91.5366, 91.5936, and 87.6154. The final benefit level is judged to be excellent with a rating of 91.1477.
This paper explores the application of multi-intelligent body optimization algorithm and BIM technology in building cost management and obtains the following conclusions:
Multi-intelligent body reinforcement learning MARL combined with BIM technology can effectively improve the intelligent level of building design and realize automatic generation of collision-free building information. Based on the secondary development of Revit, the building cost framework deepening design plug-in successfully realizes the automated modeling of BIM model, which significantly improves the efficiency of deepening design.BIM technology shows significant economic benefits in the application of the actual project, and the cost consulting cost of ZX Middle School project saves 52,242,200 yuan, and the total expenditure of traditional building cost of 4,536,199,000 yuan is far more than the expected 4,275,823 million yuan. The analysis by DEMATEL method found that the reason degree of 3D visualization is the highest (1.4453) and the center degree of cost saving is the highest (2.9633), they are the key factors of the benefits of BIM technology. The comprehensive benefit score of BIM technology of ZX middle school project is 91.1477 points, which achieves the excellent grade, among which the construction management benefit score is the highest (96.0465), the strategic benefit rating was the lowest (87.6154). The combination of multi-intelligence body optimization algorithm and BIM technology can improve the accuracy of construction cost control, reduce project costs, and promote the digital transformation of the construction industry.
This research was supported by the Wenzhou Polytechnic Project titled ’Research on Cost Optimization of Prefabricated Building Construction Based on BIM Technology’ (Project No. WZY2024015).