1. Introduction
Financial regulators and key government departments have developed policy requirements for ESG management and disclosure of listed businesses in succession, driven by the need for a comprehensive green transformation of the economy and society [1,2]. In my nation, listed firms’ ESG information disclosure has been trending upward under the direction of national policies (2009–2021). By 2020, ESG reports had been released by 27% of A-share listed corporations. Among them, among the reports released in 2020, 259 ESG reports were issued by 300 listed companies in Shanghai and Shenzhen (over 86%), indicating that the head office has a strong awareness of ESG disclosure [3,4].
All members of society pay more and use the ESG rating as a guide when making investment decisions, driven by both the market and policy. In my nation, ESG investment has only recently begun to increase [5]. Despite the modest starting scale, the growth pattern has become increasingly apparent in recent years. The financial market is becoming increasingly interested in investing in ESG-related sectors [6].
Financing is an important factor affecting the development and growth of an enterprise and the effective allocation of resources in the development process and business decision-making of an enterprise. The level of financing costs directly determines the financing decisions and financing strategies of enterprises, thereby affecting the growth and profitability of enterprises [7]. At present, the external financing methods of listed companies in my country mainly include debt financing and equity financing. Due to the late start of my country’s securities market and the imperfect regulations and policies, alongside the issue of information asymmetry in the market development process, there are also widespread problems [8]. The low quality of listed companies, imperfect information disclosure, and inadequate supervision restrict investors’ investment behavior, resulting in companies generally bearing a high cost of equity capital; and debt financing is the main financing tool for listed companies in my country [9]. A few examples of the variables that would impact the financing cost include the level of information asymmetry and the features of corporate governance. Corporate ESG performance may, influence corporate information asymmetry and other issues to some degree as a reflection of non-financial performance, including corporate governance, social responsibility, and environmental performance. This will ultimately impact corporate financing costs [10]. According to [11] analysis, business financial costs will decrease as a result of ESG spending.
This article will use a sample of 1,044 A-share listed businesses from 2016 to 2020 to empirically analyse the effect of ESG performance on corporate finance costs. Furthermore, the moderating impacts of firm size and media attention will be analysed in connection to the impact of ESG performance on business financing costs.
2. Related Work
A. Information asymmetry theory
According to the theory of information asymmetry, there aren’t enough information channels, making it difficult for outside investors to completely comprehend all of the financial and non-financial information about a company [11]. Therefore, the financial and non-financial information reports that the company releases constitute the basis for external investors’ comprehension of the enterprise’s success. sources with current information. Consequently, the quality and quantity of information that the company discloses will affect the return on capital that external investors receive. Thereby reducing information asymmetry, and finally affecting the financing costs of enterprises, making their investors require a lower rate of return [12]. The release of ESG reports reduces the cost of funding for the company by providing external investors with more information about its financial performance. [13] discovered that businesses that actively enhance their ESG performance are more prepared to allocate funds towards the risks associated with their business development, select investment portfolios that can foster growth while lowering risks, and select suitable capital structures.
B. Equity financing cost perspective
When the results of domestic and international research are combined and synthesised, it becomes clear that a number of studies demonstrate a negative correlation between the cost of equity financing and corporate social responsibility (CSR) performance. [14] discovered that when listed companies’ overall corporate governance improves, the costs associated with debt and equity financing for businesses would also go down. Furthermore, the effect of corporate governance on equity financing costs is greater than that of debt financing costs. [15] discovered that listed companies can lower their agency costs—that is, expenses related to adverse selection and moral hazard, such as by increasing management pay or employing equity incentive machines. Additionally, listed businesses will be able to cut the price of stock funding. A significant negative relationship was found between the cost of equity financing and corporate governance and the environment, while there is no significant negative relationship between social responsibility and the cost of equity financing. This conclusion was reached after analysing financial and non-financial performance (ESG) studies using a sample of over 3000 listed companies between 1990 and 2013 [16]. An empirical study with a sample of listed companies from different cultural backgrounds found that CSR efforts can reduce the cost of equity funding for enterprises. This finding was especially noteworthy when considering nations with higher humanistic orientations and lower levels of self-confidence.
3. An Empirical Examination of How Esg Performance Affects Financing Costs
A. Research on the effect of financing costs and ESG performance
Stakeholder participation is positively correlated with high ESG performance, according to the stakeholder theory. Corporate ESG report disclosures increase a company’s transparency in the capital market, which lowers information asymmetry and, as a result, a company’s ability to obtain money [17].
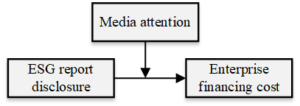
Equity financing channels are greatly affected by policies. In addition, equity investors are mainly stock investors in the market, and external investors have less access to company information, so that non-financial information from publicly traded companies (such CSR and ESG reports) may get greater attention from these investors. Investors that focus on non-financial data, however, are more perceptive to information in the market and more inclined to heed the call of ESG investment philosophy. Enterprises’ costs associated with debt financing are negatively impacted by ESG performance, and these costs are more strongly impacted by equity financing. [18] noted that ESG performance will be incorporated into the credit process to satisfy the demands of market investors and government authorities, because after being included in the credit mechanism, the compliance management of ESG risks can reduce investment costs. risk, thereby enhancing investor confidence in the enterprise, which in turn affects the financing cost of the enterprise (see Figure 1).

We suggest the following hypotheses based on the analysis:
H1: Companies can lower the cost of equity borrowing by improving their ESG performance.
H2: Enhancing ESG performance can lower a company’s debt financing costs
B. Data sources
Since the disclosure of ESG reports of Chinese listed companies has grown in scale since 2016, the time range of the sample data in this paper is from 2016 to 2020. The financial data related to listed companies is obtained through the wind database and the CSMAR database.
This research builds an unbalanced panel data set using 3484 sample observations and the annual data of 1044 enterprises. Python and stata.16 are used in this article’s data processing. The 1% and 99% levels of tailing were applied to continuous variables. The chosen businesses span 71 distinct industries, according to the China Securities Regulatory Commission’s first-level industries. The sample data is organised based on ownership attributes, size, and industry features.
C. Variable settings
The cost of equity financing, also known as the cost of acquiring equity capital, is the transfer of ownership of the business from the user of the money (the firm) to the owner of the capital (the investor). The three-factor model, the discounted dividend model, the capital asset pricing model, and the arbitrage pricing model, and the discounted dividend model’s derivatives (PEG, OJN, CT, and GLS models) are a few of the widely utilised techniques for figuring out how much equity financing will cost. Among these, the capital asset pricing model, the arbitrage pricing model, and the three-factor model all use historical data to project future returns; but, due to our non-effective market, these three computational models are not included. The dividend discount model, although it does not have a high requirement for an efficient market, is more difficult to calculate dividends per period, so it is also excluded. Given that the derivative model of the dividend discount model fully reflects the concept of matter risk forecasting, this paper selects the PEG model, which also has a relatively simple composition and also reflects the analyst’s forecast of the future earnings of the company.
The long-term dividend growth rate and EPS are assumed to be zero by the PEG model, whereas the short-term EPS growth rate is positive. This is the particular computation model.
\[{\text{EF}} = \sqrt {\frac{{ESP2 – ESP1}}{{P0}}} .\tag{1}\]
Here, ESP1 and ESP2 are the analysts’ predicted earnings per share for periods t1 and t2, respectively, and p0 is the stock price per share at the end of the time period. EF stands for the explanatory variable cost of equity financing. The CSMAR database provided the analyst forecast indicator data used in this study.
Descriptive statistics were initially conducted on the sample variables in order to guarantee the rationality of the correlation and multiple regression analyses. Furthermore, in this work, continuous variables were reduced at the 1% and 99% levels to eliminate the possible effects of outliers. The results of the derived descriptive statistics are shown in Table 1. The following is the explanatory variable for ESG performance (score): The variability of the explanatory variable ESG performance (score) level variability among the whole sample firms is rather significant, as indicated by the standard deviation (sd) of 0.944. The mean value of the score is 5.158, indicating an average level of ESG performance among the sample firms. The score has a minimum (min) value of 3 and a maximum (max) value of 7.
| variable | N | mean | p25 | p50 | p75 | sd | min | max |
|---|---|---|---|---|---|---|---|---|
| EF | 3626 | 0.061 | 0 | 0 | 0.108 | 0.082 | 0 | 0.314 |
| DF | 3626 | -0.014 | 0 | 0.03 | 0.051 | 0.229 | -1.306 | 0.297 |
| score | 3626 | 5.158 | 5 | 5 | 6 | 0.944 | 3 | 7 |
| ROE | 3626 | 9.747 | 4.13 | 9.503 | 16.15 | 15.03 | -47.76 | 47.43 |
| TAT | 3626 | 0.679 | 0.375 | 0.59 | 0.874 | 0.442 | 0.05 | 2.147 |
| ZCFZ | 3626 | 42.45 | 26.05 | 41.02 | 56.88 | 20.69 | 7.875 | 91.28 |
| CFI | 3626 | 0.219 | 0.029 | 0.136 | 0.321 | 0.332 | -0.357 | 1.415 |
| Growth | 3626 | 19.05 | 1.895 | 10.91 | 26.39 | 30.29 | -26.63 | 134.2 |
| top1 | 3626 | 33.29 | 21.9 | 30.95 | 42.86 | 14.43 | 10 | 68.26 |
| indepen | 3626 | 0.35 | 1 0.333 | 0.333 | 0.429 | 0.102 | 0 | 0.5 |
The correlation test findings between the coefficients of the important variables are shown in Table 2. The correlation coefficients between the explanatory, explained, and control variables have an absolute maximum value of 0.481, which is less than 0.5. This suggests that the correlation coefficients are quite low. Significant multicollinearity issues don’t exist.
| Variables | (EF) | (DF) | (score) | (ROE) | (TAT) | (ZCFZ) |
|---|---|---|---|---|---|---|
| EF | 1.000 | – | – | – | – | – |
| DF | -0.009 | 1.000 | – | – | – | – |
| score | 0.062*** | -0.024*** | 1.000 | – | – | – |
| ROE | 0.178*** | -0.054*** | 0.023 | 1.000 | – | – |
| TAT | 0.103*** | 0.049*** | -0.045*** | 0.377*** | 1.000 | – |
| ZCFZ | 0.053*** | 0.255*** | 0.110*** | -0.131*** | 0.021*** | 1.000 |
| CFI | 0.075*** | -0.221*** | -0.040** | 0.339*** | 0.131*** | -0.481*** |
| Growth | 0.096*** | -0.014** | -0.002 | 0.346*** | 0.154*** | -0.125*** |
| top1 | 0.078*** | -0.059*** | 0.057*** | 0.171*** | 0.104*** | 0.004 |
| indepen | -0.020** | -0.017** | 0.047*** | -0.174*** | -0.147*** | 0.002 |
D. Model building
According to the hypothesis of this paper, and the control variables are: return on net assets (ROE), gearing ratio (ZCFZ), equity concentration (topl), total asset turnover (TAT), solvency (CFI), total asset growth (Growth), independent director ratio (indepen), and the year dummy variable (year) is added to control for time effects.
Initially, multicollinearity is assessed across all sample variables to ensure the validity of the regression findings, and Table 3 shows the variance inflation factors (VIF) of the fitted models (3) and (4), and the fitted results of both models, VIF does not exceed 10, indicating that neither of them has serious multicollinearity.
| Variable | VIF(4.2) | VIF(4.3) |
|---|---|---|
| CFI | 1.56 | 1.56 |
| ZCFZ | 1.52 | 1.48 |
| ROE | 1.39 | 1.4 |
| Growth | 1.28 | 1.27 |
| TAT | 1.09 | 1.09 |
| score | 1.07 | 1.06 |
| top1 | 1.06 | 1.05 |
| indepen | 1.01 | 1.01 |
| Mean VIF | 1.24 | 1.28 |
4. Moderating Effect of Firm Size on ESG Performance Impacts Financing Costs
From the perspective of information asymmetry, large firms provide more transparent information, and as a result, these big companies can offer more information about business hazards than less transparent smaller companies. Larger firms are more mature and more resistant to internal and external uncertainties, so market investors trust larger firms more and demand lower returns. The larger the firm, the more resilient it is to various risks and the lower the risk of default, so its cost of debt will be lower than that of a smaller firm. Smaller businesses are more prone to encounter unfavourable business activity because they have less access to essential resources. Smaller businesses are typically in the expansion phase. As a company expands, it creates connections with other resource suppliers that could help the company thrive and lower business risk. Better environmental, social, and corporate governance are examples of non-financial facts that small businesses need to know in order to secure the capital they need to grow. Furthermore, small businesses gain more from corporate reputation and organisational legitimacy than do large businesses (see,Figure 2).

In summary. For firms of different sizes, the following hypotheses are proposed in this paper. H5: Firm size plays a moderating role in the link between finance costs and ESG performance. In terms of the external governance effects of the media on companies, media pressure can limit corporate decision making, while the media acts as an independent watchdog. If a company’s violations are discovered by the media, they can easily be exposed by the media, which will magnify the negative effects of these negative news and thus draw the attention of more government agencies. To prevent this, the Company will regulate the Company’s internal management through long-term external media monitoring and will make the Company’s senior management more prudent in making decisions. The company will develop on a long-term, sound and sustainable path and will be able to enhance the strength of companies in the same industry to a certain extent, improve trust to investors and reduce financing costs.(see Figure 3)
To sum up. In this study, the following theories are put out for enterprises of varying sizes. H6: Media attention is one mitigating element in the relationship between financing costs and ESG performance.
5. Analysis of empirical results
The complete sample regression results are shown in Table 4. An increase in ESG score can result in a significant increase in corporate equity financing cost, according to the analysis, which shows that the correlation coefficient between corporate ESG performance (score) and corporate equity financing cost (EF) is 0.00398. This correlation is negative and significant at the 5% level of significance. H1 is hence proven. The regression findings for the cost of equity financing (EF) as an explanatory variable are shown in Column 1. As an explanatory variable, the debt financing cost (DF) regression results are shown in Column 2.
In the regressions of both EF and DF, the coefficient of the estimated value of the profitability parameter (ROE) is negative, according to an analysis of the direction of the sign of the coefficients of the control variables, which indicates that the higher the profitability of the firm, the better it is to reduce the financing cost of the firm; the coefficient of the estimated value of the parameter of total asset turnover (TAT) is positive in the regressions of both EF and DF, which shows that a company’s financing costs increase with its turnover; the debt servicing capacity (the estimated coefficients of CFI are negative in the DF regressions, the EF and DF regressions show that the estimated coefficients of growth (growth) are negative, indicating that a firm’s financing cost decreases with its rate of expansion; the estimated coefficients of top1 are positive in the EF and negative in the DF regressions, indicating that a higher equity concentration is not helpful in lowering the cost of equity financing, but it helps to lower the cost of debt financing.
| – | (1)EF | (2)DF |
|---|---|---|
| score | -0.00398** | -0.00922*** |
| – | (0.020) | (0.009) |
| ROE | -0.000703*** | -0.000193 |
| – | (0.001) | (0.522) |
| TAT | 0.0146*** | 0.0401*** |
| – | (0.001) | (0.001) |
| CFI | 0.00702 | -0.213*** |
| – | (0.345) | (0.000) |
| top1 | 0.000261*** | -0.00101*** |
| indepen | 0.0404 | -0.0134 |
| – | (0.194) | (0.835) |
| Growth | -0.000183** | -0.000412** |
| – | (0.048) | (0.034) |
| ZCFZ | 0.000504*** | 0.00151*** |
| – | (0.001) | (0.000) |
| cons | -0.00133 | 0.0213 |
| – | (0.931) | (0.512) |
| Annual | Controlled | Controlled |
| N | 2609 | 3484 |
| R-square | 0.1611 | 0.1359 |
Replacing Shang Dao Rong Green ESG rating with CSI ESG rating (RATE), according to the results shown in Table 5, the positive and negative signs of the main variables in models (3) and (4) do not change and the p-values do not change significantly. The model can be considered robust.
| – | (1)EF | (2)DF |
|---|---|---|
| score | -0.0105*** | -0.0176*** |
| – | (0.001) | (0.001) |
| ROE | 0.000488*** | 0.000105 |
| – | (0.001) | (0.610) |
| TAT | 0.0106*** | 0.0403*** |
| – | (0.001) | (0.001) |
| CFI | 0.0172*** | -0.209*** |
| – | (0.000) | (0.001) |
| top1 | 0.000171*** | -0.00103*** |
| – | (0.001) | (0.001) |
| indepen | -0.0172 | 0.111* |
| – | (0.195) | (0.066) |
| Growth | 0.000127*** | 0.000150 |
| – | (0.001) | (0.163) |
| ZCFZ | 0.000486*** | 0.00326*** |
| – | (0.001) | (0.001) |
| cons | -0.0166*** | -0.0822*** |
| – | (0.006) | (0.003) |
| Annual | Controlled | Controlled |
| N | 13393 | 16061 |
| R-square | 0.2105 | 0.1972 |
The novel variable the explanatory variable (ROE) is replaced by Tobin’s Q (TBQ), and the ratio of finance costs to interest-bearing debt (DF2) is used in place of the explanatory variable (DF) in the new variable debt financing cost measure. According to the results shown in Table 6, the positive and negative signs of the main variables in models (3) and (4) do not change and there is no significant change in the p-value.
| – | (1)TBQ | (2)DF2 |
|---|---|---|
| score | -0.0561** | -0.488 |
| – | (0.012) | (0.591) |
| ROE | 0.00809*** | -0.0636 |
| – | (0.001) | (0.300) |
| TAT | 0.0706 | 2.526 |
| – | (0.120) | (0.172) |
| CFI | 1.285*** | -2.936 |
| – | (0.001) | (0.500) |
| top1 | -0.00743*** | -0.00765 |
| – | (0.001) | (0.885) |
| indepen | 0.834** | 2.836 |
| – | (0.022) | (0.848) |
| Growth | 0.00871*** | 0.00949 |
| – | (0.001) | (0.839) |
| ZCFZ | -0.0183*** | 0.0856* |
| – | (0.001) | (0.085) |
| cons | 2.844*** | -5.925 |
| – | (0.001) | (0.451) |
| Annual | Controlled | Controlled |
| N | 3605 | 3406 |
| R-square | 0.2014 | 0.1735 |
6. Conclusion
The notion of ESG investing has been gradually gaining traction in the context of carbon neutrality and green development in recent years, global investment institutions began to advocate and practice responsible investment based on ESG concept in their investments. Currently, a growing number of domestic and foreign investment institutions adopt ESG investing, which has steadily joined the mainstream of international investing. This essay is grounded in the body of current literature. A panel regression model is constructed for a sample of 1044 A-share listed corporations from 2016 to 2020 using ESG rating data.
Based on the empirical study, it is found that as ESG performance increases, the cost of debt financing and the cost of equity financing also reduce for the full sample. For non-polluting enterprises in the industry sample, the effect of ESG performance on equity financing costs is greater than for polluting companies. This is because investors typically overlook polluting enterprises’ attempts to enhance their own environmental performance due to preconceived notions about these companies. Market investors trust larger organisations more because they are able to provide information on a wider variety of business hazards than smaller firms that are less transparent. This is because larger firms are able to supply more transparent information. Bigger companies will pay less for debt since they are more resilient to different hazards and have a lower default risk than smaller companies.
Funding
This work was supported by the academic subject “Research on the coordinated development of Chengdu-Chongqing twin city economic circle construction and higher vocational colleges”. Project Number:CQGJ21B163.