
Cable intermediate joints play a crucial role in the connection and transition of power transmission and are essential for the safe and reliable operation of power systems [1], [2]. Therefore, a high level of installation skill is required. However, during the production process, factors such as installation procedures and techniques, the surrounding environment, and damage caused by external forces can lead to defects on the joint surface. These defects may include stains or scratches on the main insulation, uneven stripping of the outer semi-conductive layer, uneven chamfering at the end of the main insulation, unpolished burrs after crimping the connecting tube, and substandard main insulation sizes [3], [4]. Consequently, once the intermediate joints are put into operation, distortion in the electric field will occur in the defect areas. Additionally, prolonged operation tends to cause partial discharge and may even result in joint breakdown, which seriously threatens the safe operation of the power system [5], [6]. Existing image recognition technology for cable surface defects, which is based on the grayscale difference between defect and non-defect areas proposed by scholars, can effectively extract the contours of these defects. To monitor the cable construction process, Reference [7] proposes a system utilizing image processing algorithms to analyze cable images and identify potential faults, including unbalanced currents, cable sheath faults, and short-circuit faults. Reference [8] presents an edge segmentation algorithm for detecting edges in power cable defect images, capable of accurately identifying three types of defects in surface scratches. Reference [9] proposes an intelligent recognition method based on the Faster R-CNN network and the Mean-Shift algorithm, which extracts specific features to construct the neural network input for the intelligent recognition of infrared images of electrical equipment. Reference [10] utilizes the bi-directional and two-dimensional (2-D) maximum margin criterion (MMC) to perform horizontal and vertical 2-D orthogonal projections of partial discharge (PD) grayscale intensity images, further extracting local discharge grayscale image features to identify insulation defects in high-voltage cross-linked polyethylene power cable joints. Reference [11] facilitates the diagnosis of the condition of cable accessories by proposing an automatic infrared image diagnostic method for cable accessory defects based on YOLOv3 and mean shift. Reference [12] presents a method for classifying process defects in 36 kV cross-linked polyethylene (XLPE) cable terminals using Convolutional Neural Networks (CNN), which is effective for identifying potential defect types in cable terminals. The aforementioned studies employ image processing methods to recognize and monitor surface defects in cables. However, due to the different types of defects in the main insulation, outer semi-conductive layer, and crimping tube of the cable, distinct identification methods are required. However, these studies have not achieved high-precision identification of various defects.
The segmentation methods for cable intermediate joint components include traditional segmentation algorithms based on threshold, region, and pixel classification, as well as those based on convolutional neural networks. However, due to the subtle nature of surface defects on cables, traditional methods often result in incomplete segmentation. Therefore, this paper employs the U-Net algorithm, which is highly precise, to segment the main insulation, outer semi-conductive layer, and crimping tube. Currently, the U-Net segmentation method is widely used in medical, agricultural, and engineering image segmentation. Reference [13] introduces a U-Net algorithm with a supervised attention mechanism to achieve retinal blood vessel segmentation. Reference [14] proposes a novel framework that combines a deep Convolutional Neural Network (CNN) architecture with a U-Net-based segmentation model. This innovative framework can be applied clinically to automatically identify and segment brain tumors using MRI scan images. Reference [15] develops a Dilated-U-Net-Seg deep learning technique for effective segmentation of polyp regions, which is significant for colorectal cancer prevention. Reference [16] proposes an improved U-Net-based method for insulator segmentation, achieving accurate recognition and segmentation of insulator strings in complex background images with varying appearances and occlusions. Reference [17] introduces an improved U-Net (MU-Net) algorithm for segmenting images of diseased plant leaves by incorporating residual blocks (Resblocks) and residual paths (Respaths), enabling the segmentation of diseased plant leaves. Reference [18] presents a multi-scale feature fusion superpositioned U-Net (MPSU-Net) method based on deep learning that achieves quantitative analysis of road cracks. The aforementioned studies focus on single-object segmentation, whereas this paper aims to achieve segmentation of the main insulation, outer semi-conductive layer, and crimping tube of cables. Therefore, a method based on the U-Net model for segmenting various cable components is proposed.
Considering the subtle nature of cable construction defects, the Canny algorithm is employed to extract edge information. Compared to other algorithms, the Canny algorithm offers advantages such as a high detection rate for subtle cable surface defects, accurate positioning of edge points, and a single-edge-point response [19], [20]. Therefore, this paper adopts a combined approach utilizing both the U-Net and Canny algorithms. Firstly, the cable diagram is divided into three parts using the U-Net algorithm: the outer semi-conductive layer, crimping tube, and main insulation. Secondly, edge information of the three components is extracted using the Canny algorithm. Finally, the extracted information is fitted into a quadratic function, followed by the use of the extremum or mean square deviation of the function to determine whether the components are defective. Next, the number of edge pixels on the main insulation is calculated, and a pixel threshold is set to identify the presence of stain or scratch defects. In general, the proposed combined approach utilizing both the U-Net and the Canny algorithms can detect various types of defects with high precision, enabling targeted rework of cable construction defects and significantly preventing cable failure after implementation.
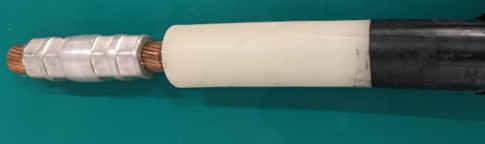
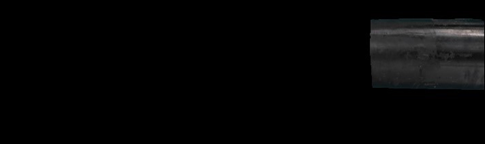
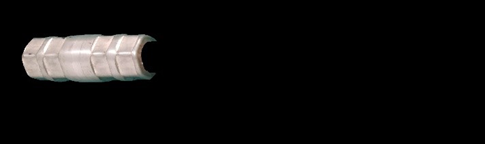
The schematic diagram of the cable intermediate joint is presented in Figure 1.
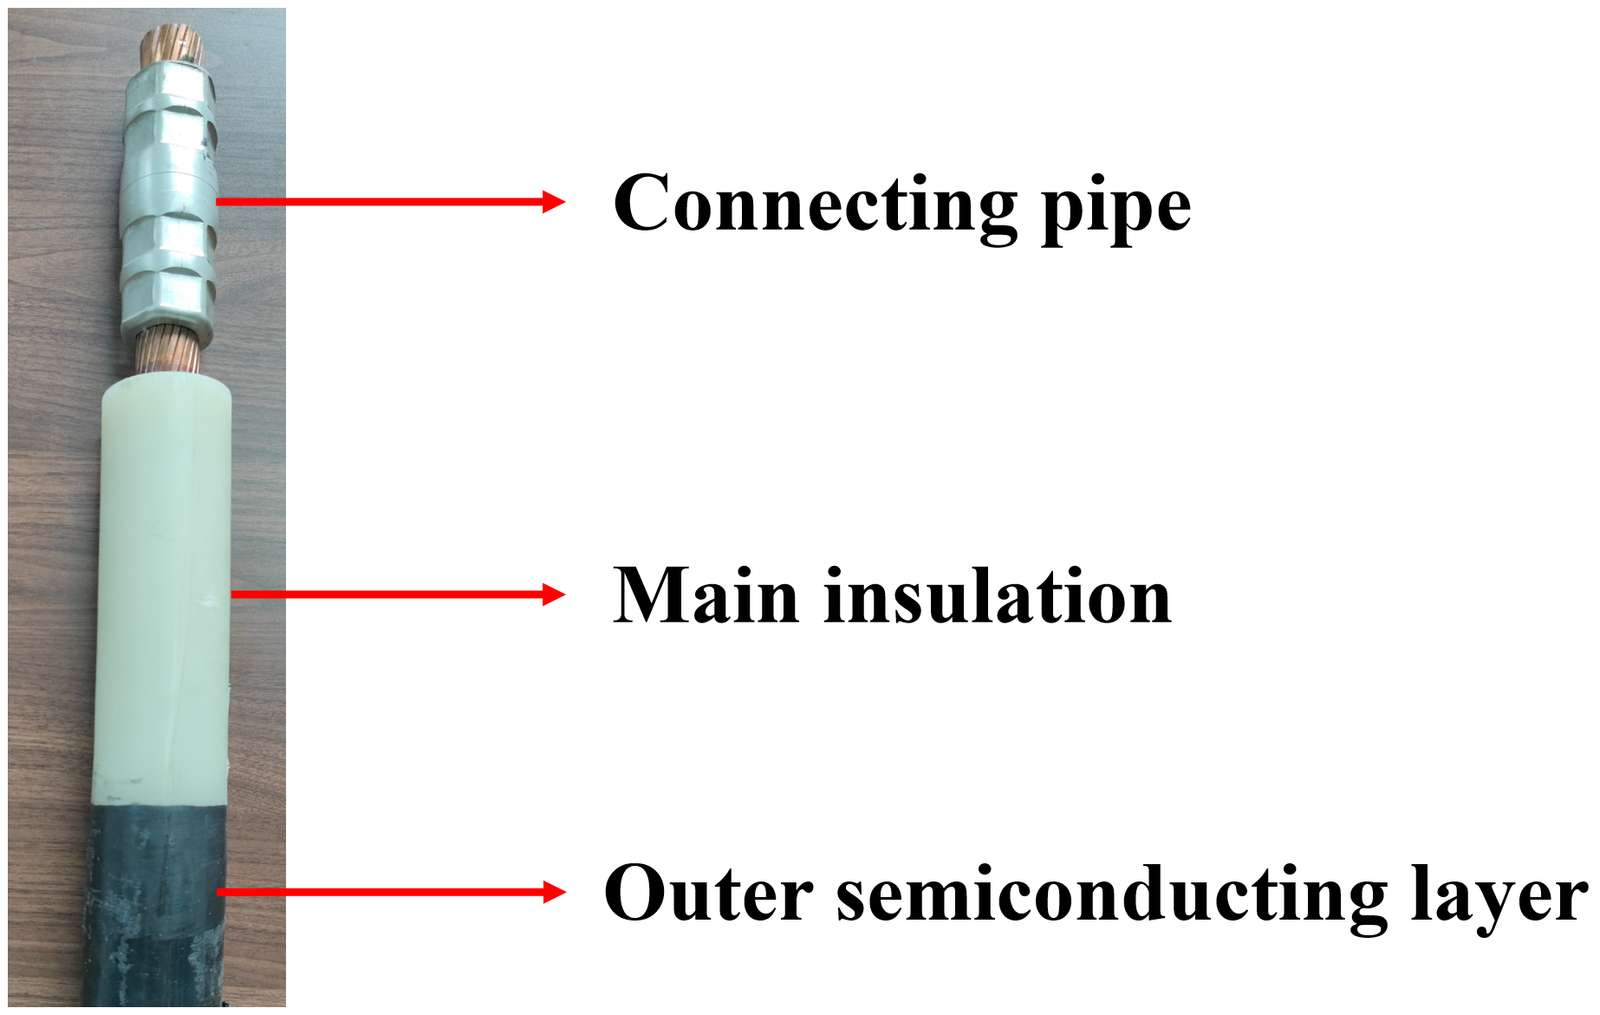
The cable intermediate joint depicted in Figure 1 is in a crimped state. The components requiring inspection include the main insulation, the semi-conductive layer, the boundary between the core and the main insulation, and the crimping tube.
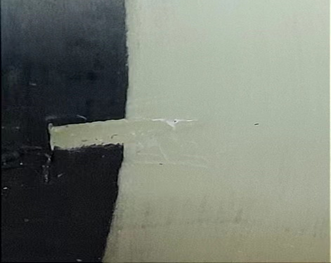
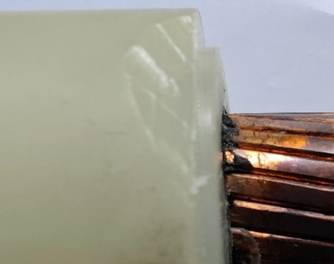
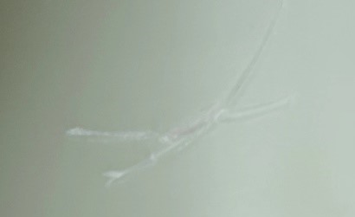
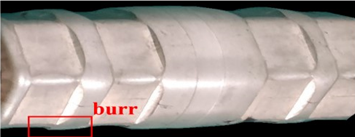
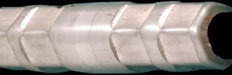
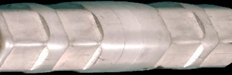
Uneven stripping of the outer semi-conductive layer and the main insulation, resulting from improper and non-standard stripping techniques employed by construction personnel, is illustrated in Figures 2 and 3. Scratches on the surface of the main insulation, caused by excessive stripping force, are depicted in Figure 4. Stains on the main insulation surface, resulting from a harsh construction environment and inadequate cleaning by construction personnel, are shown in Figure 5. Burrs in the crimping tube, which emerged due to insufficient grinding, are presented in Figure 6.
The cable intermediate joint consists of three components: the main insulation, the outer semi-conductive layer, and the crimping tube. Each component exhibits distinct characteristics related to construction defects. For the main insulation, stain and scratch defects are identified through the presence of edge information. By extracting edge points using the Canny algorithm and counting the number of edge points, the detection of defects can be accomplished. In the case of the crimping tube, the presence of burrs is indicated by an increase in the curvature of the edge. By fitting the edge curves and calculating the extrema, defects can be identified. A neatly stripped dividing line approximates a curve, making it unsuitable for identifying defects based solely on extreme values. Instead, the mean square error method can be employed to determine the presence of uneven stripping defects.
Based on the preceding discussion, it is reasonable to conclude that achieving high-precision identification of various types of cable construction defects requires segmenting the cable intermediate joint images into three components: the main insulation, the outer semi-conductive layer, and the crimping tube. The U-Net-based intelligent algorithm can accurately extract images of these three components, which is an essential prerequisite for the subsequent extraction of edge information.
As illustrated in Figure 1, the colors of the cable components vary significantly: the main insulation is blue, the outer semi-conductive layer is black, and the crimping tube is bronze. The boundaries of these components are clearly defined, enabling the algorithm utilized in this section to segment them with high precision. The flowchart of the algorithm segmentation process is presented in Figure 7.
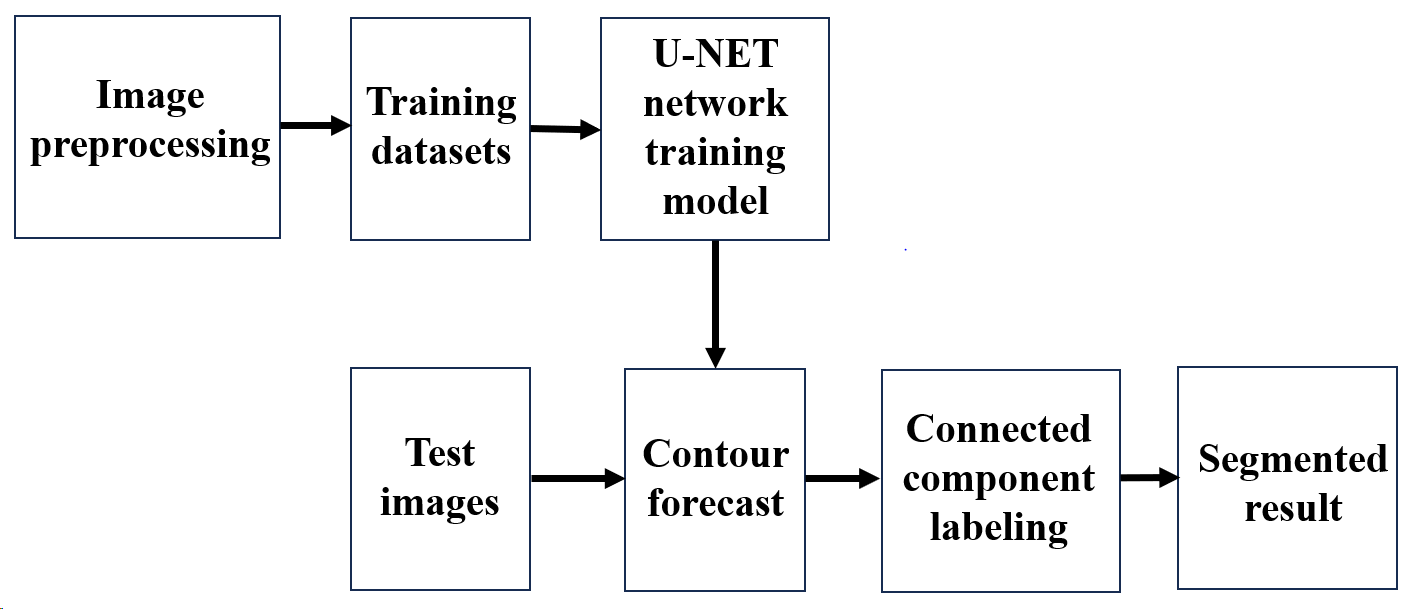
The segmentation method proposed in this section comprises two stages: the training stage and the detection stage. In the training stage, a large number of cable intermediate joint images are first collected to create a training set. These images are then labeled and denoised before being imported into the U-Net network training model, resulting in the optimal model after training. In the detection stage, the optimal model is employed to detect the contours of the cable intermediate joint image, yielding a tricolor contour map, as shown in Figure 10. Subsequently, the connected regions of different colors are marked, with each color corresponding to a distinct grayscale value. Finally, by utilizing grayscale differences and algebraic inverse transformation, the segmentation of the cable joint image is accomplished.
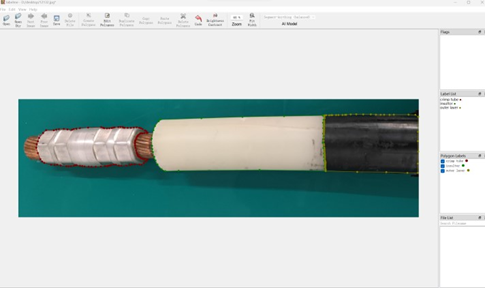
This paper utilizes a CCD (Charge Coupled Device) camera to collect a total of 150 images of cable intermediate joints, which serve as data samples, as shown in Figure 8. The LabelMe software tool is subsequently employed to annotate these data samples, as illustrated in Figure 9.
Experimental setup: The processor model is AMD Ryzen 9 7945HX, the graphics card is NVIDIA GeForce RTX 4060 Laptop GPU, the memory is 16 GB, and the operating system is Windows 11. The experiments are conducted under the PyTorch framework, using Python 3.11 and the CUDA 11.7 acceleration library. The training and testing sets in the dataset are divided in a ratio of 9:1.
Parameter settings: The number of training iterations is 300, the batch size is 4, the initial learning rate is 0.0001, and the optimizer used is the Adam algorithm.
The evaluation metrics used are standard indicators for semantic segmentation: accuracy, which reflects the overall classification capability of the model; precision, which primarily measures the accuracy of the model’s predictions; and recall, which assesses the model’s ability to identify the target, i.e., detecting as many positive sample pixels as possible. The specific calculation formulas are as follows: \[\label{GrindEQ__1_} A{\rm c}curacy=\frac{TP+TN}{TP+TN+FP+FN} , \tag{1}\] \[\label{GrindEQ__2_} Precision=\frac{TP}{TP+FP} , \tag{2}\] \[\label{GrindEQ__3_} Recall=\frac{TP}{TP+FN} . \tag{3}\]
In this context, TP (True Positive) refers to the number of pixels correctly segmented as the foreground, FP (False Positive) refers to the number of pixels incorrectly segmented as the foreground, FN (False Negative) refers to the number of positive sample pixels not identified as foreground, and TN (True Negative) refers to the number of pixels correctly segmented as the background.
This paper selects 10 cable images and utilizes the model trained earlier to make predictions, obtaining the corresponding predicted images. By comparing these with the actual segmented images, the respective evaluation metrics are calculated, and the results are presented in Table 1.
| Image | Accuracy | Recall | Precision |
|---|---|---|---|
| 1 | 0.9953 | 0.9959 | 0.9799 |
| 2 | 0.9949 | 0.9874 | 0.9881 |
| 3 | 0.9965 | 0.9913 | 0.9874 |
| 4 | 0.9966 | 0.9931 | 0.9864 |
| 5 | 0.9950 | 0.9891 | 0.9874 |
| 6 | 0.9937 | 0.9869 | 0.9798 |
| 7 | 0.9941 | 0.9926 | 0.9735 |
| 8 | 0.9950 | 0.9904 | 0.9787 |
| 9 | 0.9947 | 0.9915 | 0.9800 |
| 10 | 0.9937 | 0.9933 | 0.9705 |
From the data of various indicators in the table, it can be observed that from images 1 to 10, the fluctuations in each indicator are minimal, indicating that the model exhibits good consistency in segmentation performance across different images. This demonstrates that the model has strong generalization ability, allowing it to stably handle different input images. The model performs excellently in segmentation tasks, achieving high accuracy and recall, indicating its effectiveness in recognizing and segmenting target regions. The precision is somewhat lower, particularly for certain images where some false positives are present; however, the overall false positive rate remains at a low level.
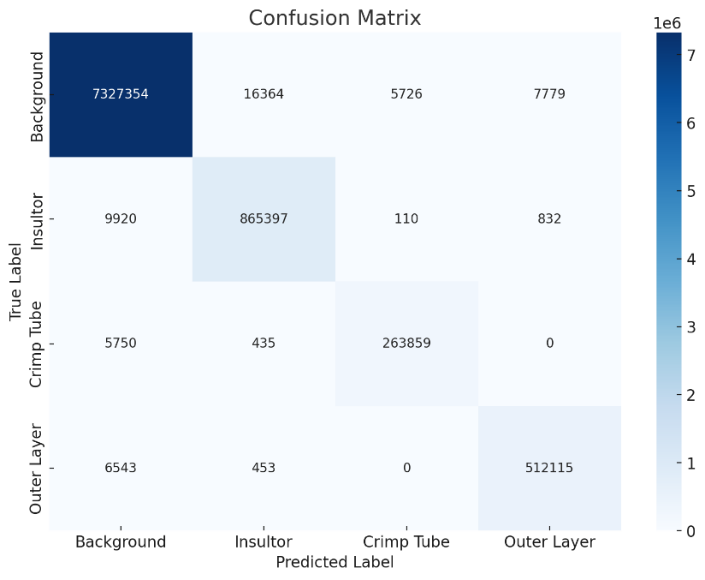
To further evaluate the classification performance and misclassification of the model across categories, we introduce the confusion matrix, as shown in Figure 10. This matrix displays the number of correct classifications by the model for each category, revealing the level of confusion between different categories. By conducting a pixel-wise comparison between the model’s predictions and the true labels, we recorded the correct classifications (True Positive) and misclassifications (False Positive, False Negative) for each category, thereby constructing the confusion matrix.
From this confusion matrix, it can be seen that the model demonstrates high accuracy in the image segmentation tasks across four categories, particularly showing good stability and reliability in the main categories of background and main insulation. Furthermore, the identification of the crimping tube and outer semi-conductive layer categories also maintains a high level of distinction, with a low misclassification rate, indicating that the model possesses strong generalization ability and robustness in multi-class segmentation tasks.
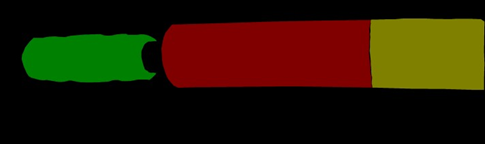
Based on the analysis of the aforementioned indicator results and the confusion matrix, it is evident that the segmentation model proposed in this paper exhibits good performance in component segmentation. This model effectively achieves the contour detection of various cable components, as shown in Figure 11. It is clear from the image that the contour map consists of three colors: red for the main insulation, green for the crimping tube, and yellow for the outer semi-conductive layer. Next, the connected regions are marked with different colors, each corresponding to a different grayscale value: red for 38, green for 75, and yellow for 113. Finally, the segmentation of the cable intermediate joint image is achieved by utilizing grayscale value differences combined with algebraic inverse transformation. The segmented images are shown in Figures 12 and 14.
The intermediate joint is classified into three distinct components: the main insulation, the outer semi-conductive layer, and the crimping tube, based on the U-Net algorithm. To address the issue of varying defect characteristics across different components, this section employs the Canny algorithm to extract edge information and develops distinct identification methods tailored to various defect types.
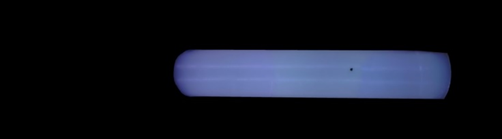
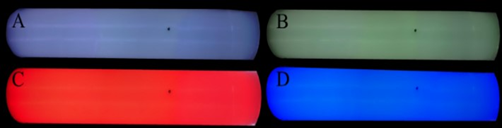
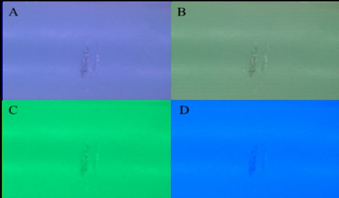
The image of the main insulation stain utilized in this paper is presented in Figure 15 and Figure 16. The diameter of the stain defect measures 0.7 mm. Given that the acquisition device for the intermediate joint is sealed and relies on a light strip as the light source, it is essential to consider the effect of light color on the detection results.
In the following figure, (A) is illuminated with original light, (B) with yellow light, (C) with red light, and (D) with blue light, as illustrated in Figure 16.
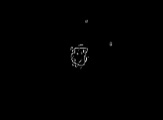
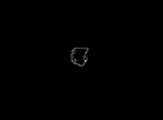
In practical applications, stain-type defects are often subtle. This paper enhances the algorithm’s performance through magnification processing, facilitating a more intuitive perception. Specifically, this paper extracts edge information from Figures 17 (A), (B), (C), and (D), and subsequently adjusts the algorithm’s threshold values to investigate the effects of varying thresholds and different colored lighting on the experimental results. During this process, the main insulation surface of the cable is artificially marked with stains, and edge detection is performed using the Canny algorithm. The experimental results are presented in Table 2.
| Serial Number | Threshold Value | Natural Light | Yellow Light |
|---|---|---|---|
| 1 | 20 | 
|
|
| 2 | 40 |

|

|
| 3 | 60 |
|

|
| 4 | 80 |

|
|
| 5 | 100 |

|

|
| 6 | 200 |

|

|
| Serial Number | Threshold Value | Red Light | Blue Light |
|---|---|---|---|
| 1 | 20 |
|

|
| 2 | 40 |

|

|
| 3 | 60 |

|

|
| 4 | 80 |

|

|
| 5 | 100 |
|
|
| 6 | 200 |

|
 |
When the main insulation is free of defects, the detection results should exhibit no edge information. Experiments indicate that under natural light, when the edge detection threshold range is [20-200], missed detections of stains on the main insulation surface occur. As the threshold gradually increases, the likelihood of missed detections rises. When stains on the main insulation surface are detected under yellow lighting, the resulting images indicate that all three stains are clearly visible and retain their complete shape, with no missed detections. The detection performance is satisfactory, with the optimal threshold range determined to be [20-80].
The detection results under red light are comparable to those under blue light, exhibiting missed detections irrespective of the threshold range. In contrast, the images of the stains on the main insulation under yellow lighting reveal more detailed defects and retain more comprehensive information, with the optimal threshold range determined to be [40-80].
Similar to stain defects, increasing the threshold under blue and red light leads to a loss of detection information. Under both natural and yellow light, threshold values in the range of [10-50] are more effective in retaining scratch information. Analysis of the experimental results suggeststhat setting the threshold too low results in high detection intensity, which leads to the inclusion of excessive unnecessary feature information. Conversely, when the threshold is set too high, scratch features may be filtered out.
| Serial Number | Threshold Value | Natural Light | Yellow Light |
|---|---|---|---|
| 1 | 10 | 
|
|
| 2 | 25 |
|
|
| 3 | 35 |
|
|
| 4 | 45 |
|

|
| 5 | 50 |
|
|
| Serial Number | Threshold Value | Green Light | Blue Light |
|---|---|---|---|
| 1 | 10 |
|
|
| 2 | 25 |
|
|
| 3 | 35 |
|
|
| 4 | 45 |
|

|
| 5 | 50 |

|
 |
Following the experiments, the threshold range for scratch detection has been confirmed as [10,50], facilitating relatively complete detection of scratches while excluding other unnecessary feature information. Similar to stain defects, the minimum detectable value for scratches in this study is also 0.4 mm, equivalent to a length of 0.4 cm or an area of 0.4 cm\(^2\).
If the crimping tube is not polished, burr defects may arise, resulting in uneven edges and spikes. This paper extracts edge information using the Canny algorithm and fits the edge points to a quadratic function. When burr defects are present, the fitting function will exhibit unreasonable extreme points. By calculating the extreme values, it becomes straightforward to determine whether burr defects are present.
The relationship between burrs on the crimping tube and its surface indicates that the peak value of the fitted equation represents the position where the burr protrudes most severely. By comparing the peak values, it is possible to ascertain whether burr defects are present on the crimping tube.
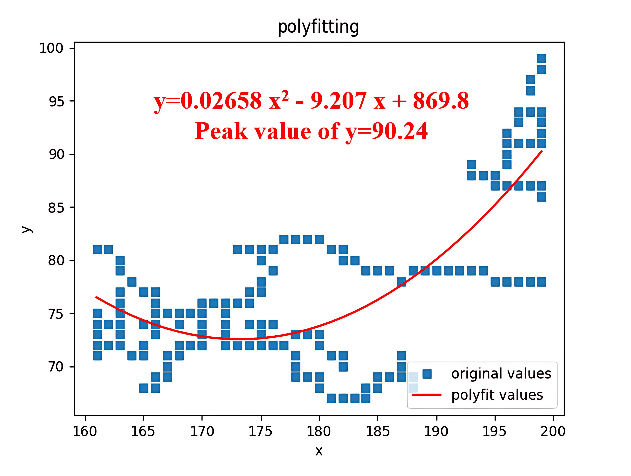
After conducting repeated experiments, this paper analyzes the extreme values of the fitting functions associated with burr defects on crimping tubes. The results suggest that when the extreme values of the fitting functions fall within the range [80,100], no burr defects exist on the crimping tube.
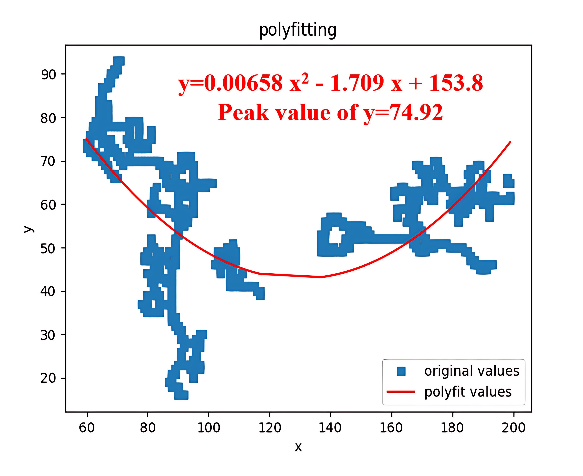
During the stripping process of the outer semi-conductive layer, if construction personnel do not adhere to strict procedures, it may lead to notches or protrusions in the semi-conductive layer, resulting in an irregular arc. The Canny algorithm is employed to extract the boundary line of the outer semi-conductive layer, which is then fitted to a quadratic function. Given that the neatly stripped interface possesses a certain curvature and an extreme point, using the magnitude of the extreme value to identify the presence of uneven stripping defects is not appropriate. Clearly, irregular stripping results in an irregular arc, which may cause a significant discrepancy between the actual edge points and the fitted values of the function. Therefore, the presence of defects in the stripping can be identified by calculating the value of the fitted mean square error.
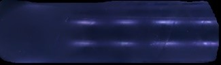
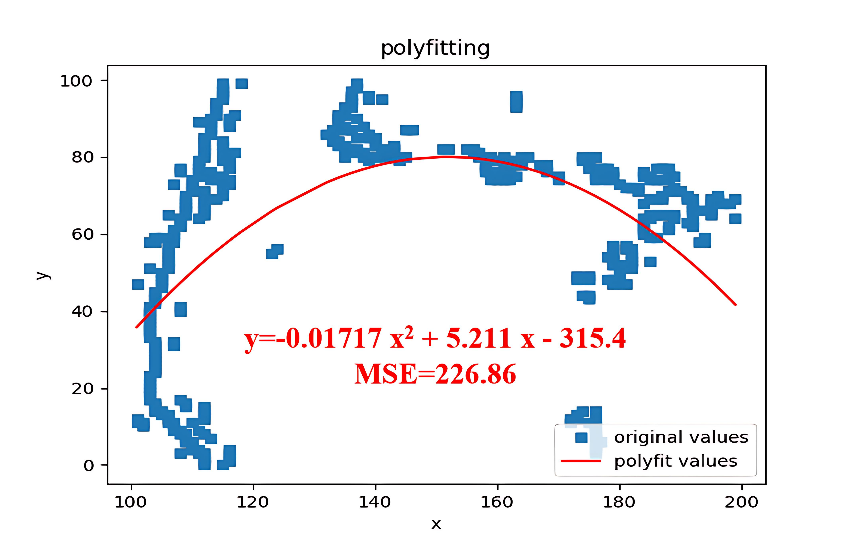
Using U-Net segmentation as described in section II, images containing only the outer semi-conductive layer were obtained, as shown in Figure 20. Next, based on the Canny algorithm, edge information points are extracted and fitted to a quadratic function. Subsequently, the mean square error is calculated using the following formula [21],[22] . \[\label{GrindEQ__4_} MSE=\frac{1}{n} \sum _{i=1}^{n}(y_{i} -{\mathop{y}\limits^{\wedge }} _{i} )^{2} . \tag{4}\]
In the formula, n represents the total number of edge points, yi denotes the size of the fitted edge points to be detected, and y i signifies the size of the defect-free edge points. The quadratic equation is fitted with the independent variable interval specified as [0, 140]. The mean square error is illustrated in Figure 21 below.
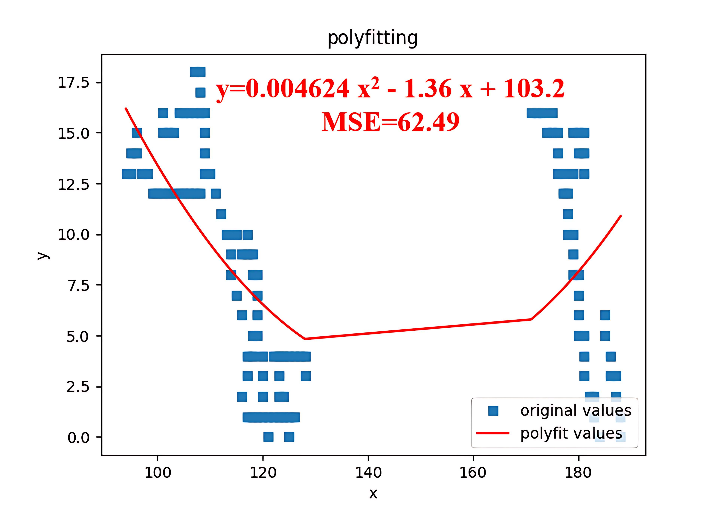
By fitting the image, the mean square error (MSE) for all points on the fitting function can be calculated. Utilizing the MSE, we can determine whether the stripping is uneven. Experimental results indicate that when the MSE exceeds 200, an uneven stripping defect is present. Therefore, this criterion is practical for detecting defects.
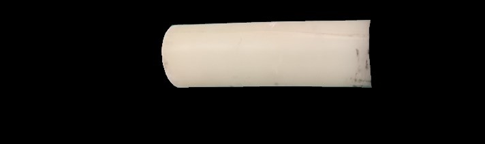
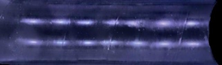
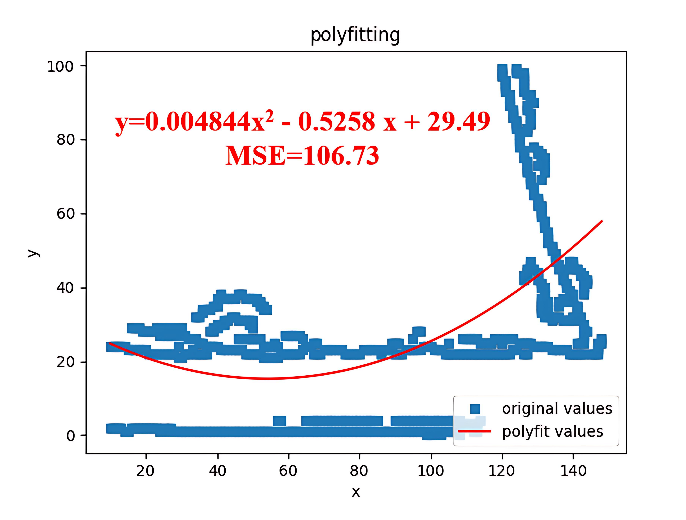
Similar to the uneven stripping of the outer semi-conductive layer, the mean square error (MSE) of the fitting function is utilized to determine whether an uneven stripping defect of the main insulation exists. The main insulation image obtained through U-Net algorithm segmentation is presented in Figure 22.
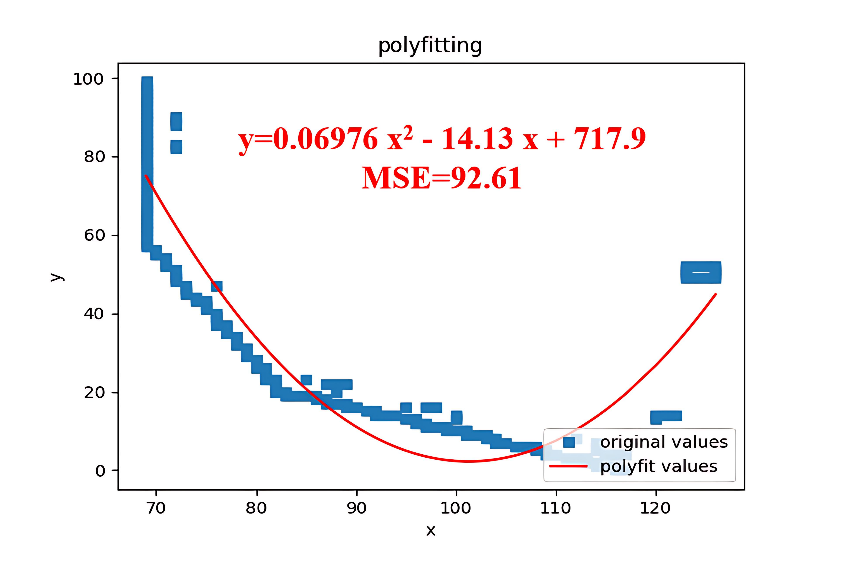
Experiments demonstrate that when the mean square error (MSE) of the fitting function falls within the range of [0,200], no uneven stripping defect is present in the main insulation. Based on the fitting quadratic equation, with the independent variable interval specified as [0, 140], the resulting mean square error is illustrated in Figure 23.
This paper simulates defects in cable joints during the construction process and obtains cable samples that closely resemble those with actual construction defects. The simulated defects exhibit a high degree of similarity to real defects. Through numerous experiments, the identification results for different types of defects were obtained, with the recognition rates presented in the Table 6 below:
| defect type | detected iterations | Number of successful identifications | recognition rate (%) |
|---|---|---|---|
| Main insulation scratch stains | 130 | 123 | 94.61 |
| Uneven Semi-Conductive Notch | 110 | 103 | 93.64 |
| Pressure nozzle burr | 120 | 109 | 90.83 |
| Neatness of Main Insulation Edge Cutting | 120 | 114 | 94.16 |
In light of the current lack of high-precision methods for identifying defects in various components, this paper proposes a defect detection method that integrates the U-Net algorithm with the Canny algorithm. The U-Net algorithm accurately segments these components, while the Canny algorithm effectively extracts their edge information, achieving an accuracy rate of over 90%. The proposed algorithm enhances the capability to identify different types of defects, thereby improving the reliability of cable operations prior to their deployment.
It is evident that utilizing specific algorithms tailored to different types of defects can enhance the accuracy of defect recognition. The method introduced in this paper efficiently detects defects such as scratches and stains on the main insulation, burrs on the crimping tube, uneven cuts in the semi-conductive layer, and irregular cuts along the edges of the main insulation, thereby providing reliable measures for managing and controlling the quality of cable construction technology.
Conceptualization, Z.C. and Y.Z.; methodology, Y.Z.; software, C.F.; validation, J.Y. and R.X.; formal analysis, B.L.; data curation, Y.Z.; writing—original draft preparation, Y.Z.; writing—review and editing, Z.C.; supervision, R.X.; project administration, J.Y. All authors have read and agreed to the published version of the manuscript.
This work was supported in part by Science and Technology Projects of State Grid Corporation of China (5500-202255402A-2-0-ZN).
The original contributions presented in this study are included in the article. Further inquiries can be directed to the corresponding author.
The authors declare no conflicts of interest.